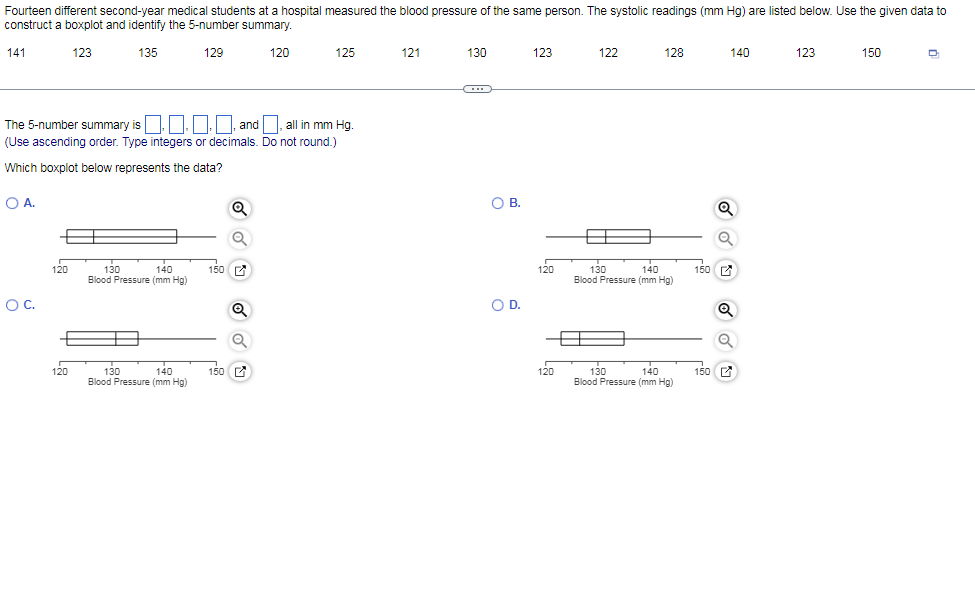
Fourteen different second-year medical students at a hospital measured the blood pressure of the same person. The systolic readings (mm Hg) are listed below. Use the given data to construct a boxplot and identify the 5-number summary. 141 123 135 129 120 125 121 130 123 122 128 140 123 150
Fourteen different second-year medical students at a hospital measured the blood pressure of the same person. The systolic readings (mm Hg) are listed below. Use the given data to construct a boxplot and identify the 5-number summary. 141 123 135 129 120 125 121 130 123 122 128 140 123 150

Mathematics For Machine Technology
8th Edition
ISBN:9781337798310
Author:Peterson, John.
Publisher:Peterson, John.
Chapter29: Tolerance, Clearance, And Interference
Section: Chapter Questions
Problem 16A: Spacers are manufactured to the mean dimension and tolerance shown in Figure 29-12. An inspector...

Related questions
Question
124 and 58 solve both plz
Transcribed Image Text:Fourteen different second-year medical students at a hospital measured the blood pressure of the same person. The systolic readings (mm Hg) are listed below. Use the given data to
construct a boxplot and identify the 5-number summary.
141
123
135
129
120
125
121
130
123
122
128
140
123
150
(...
The 5-number summary is | and , all in mm Hg.
(Use ascending order. Type integers or decimals. Do not round.)
Which boxplot below represents the data?
OA.
OB.
В.
130
140
Blood Pressure (mm Hg)
120
140
130
Blood Pressure (mm Hg)
150
150
120
OC.
OD.
130
140
Blood Pressure (mm Hg)
130
140
Blood Pressure (mm Hg)
120
150 E
120
150 C
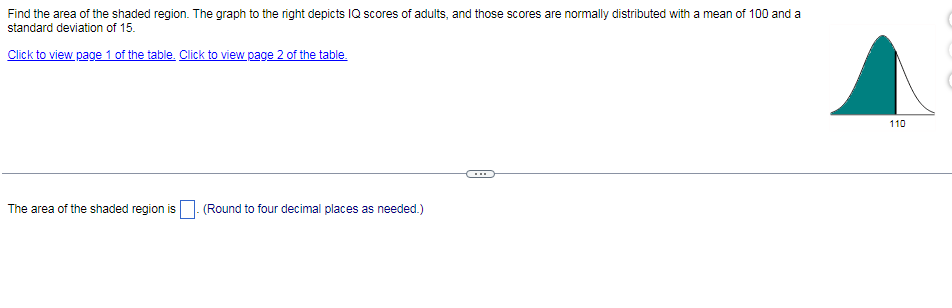
Transcribed Image Text:Find the area of the shaded region. The graph to the right depicts IQ scores of adults, and those scores are normally distributed with a mean of 100 and a
standard deviation of 15.
Click to view page 1 of the table. Click to view page 2 of the table.
110
The area of the shaded region is | (Round to four decimal places as needed.)
Expert Solution
This question has been solved!
Explore an expertly crafted, step-by-step solution for a thorough understanding of key concepts.

This is a popular solution!

Trending now
This is a popular solution!

Step by step
Solved in 4 steps

Recommended textbooks for you
Mathematics For Machine Technology
Advanced Math
ISBN:
9781337798310
Author:
Peterson, John.
Publisher:
Cengage Learning,

Holt Mcdougal Larson Pre-algebra: Student Edition…
Algebra
ISBN:
9780547587776
Author:
HOLT MCDOUGAL
Publisher:
HOLT MCDOUGAL

Glencoe Algebra 1, Student Edition, 9780079039897…
Algebra
ISBN:
9780079039897
Author:
Carter
Publisher:
McGraw Hill
Mathematics For Machine Technology
Advanced Math
ISBN:
9781337798310
Author:
Peterson, John.
Publisher:
Cengage Learning,
Holt Mcdougal Larson Pre-algebra: Student Edition…
Algebra
ISBN:
9780547587776
Author:
HOLT MCDOUGAL
Publisher:
HOLT MCDOUGAL
Glencoe Algebra 1, Student Edition, 9780079039897…
Algebra
ISBN:
9780079039897
Author:
Carter
Publisher:
McGraw Hill