The number of Facebook users for each year from 2004 to 2016 can be found in the table below.Round all values to three decimal places. Year 2004 2005 || 2006 | 2007 | 2008 | 2009 | 2010 | 2011 | 2012 | 2013 2014 | 2015 | 2016 Users 1 in millions 1056 1230 1440 | 1710 || 2000 6 12 58 145 360 608 845 Using years since 2000, do both exponential and logistic regression and be sure to graph them and compare them to the scatterplot of the data. What model is the best fit to the data? O exponential O logistic What is the equation of the best fit model? Based on this model, what will be the number of Facebook users in the year 2025? Is that value reasonable or not? Explain why. O Yes, the answer is reasonable. O No, the answer is not reasonable.
The number of Facebook users for each year from 2004 to 2016 can be found in the table below.Round all values to three decimal places. Year 2004 2005 || 2006 | 2007 | 2008 | 2009 | 2010 | 2011 | 2012 | 2013 2014 | 2015 | 2016 Users 1 in millions 1056 1230 1440 | 1710 || 2000 6 12 58 145 360 608 845 Using years since 2000, do both exponential and logistic regression and be sure to graph them and compare them to the scatterplot of the data. What model is the best fit to the data? O exponential O logistic What is the equation of the best fit model? Based on this model, what will be the number of Facebook users in the year 2025? Is that value reasonable or not? Explain why. O Yes, the answer is reasonable. O No, the answer is not reasonable.

Chapter6: Exponential And Logarithmic Functions
Section6.8: Fitting Exponential Models To Data
Problem 3TI: Table 6 shows the population, in thousands, of harbor seals in the Wadden Sea over the years 1997 to...

Related questions
Question
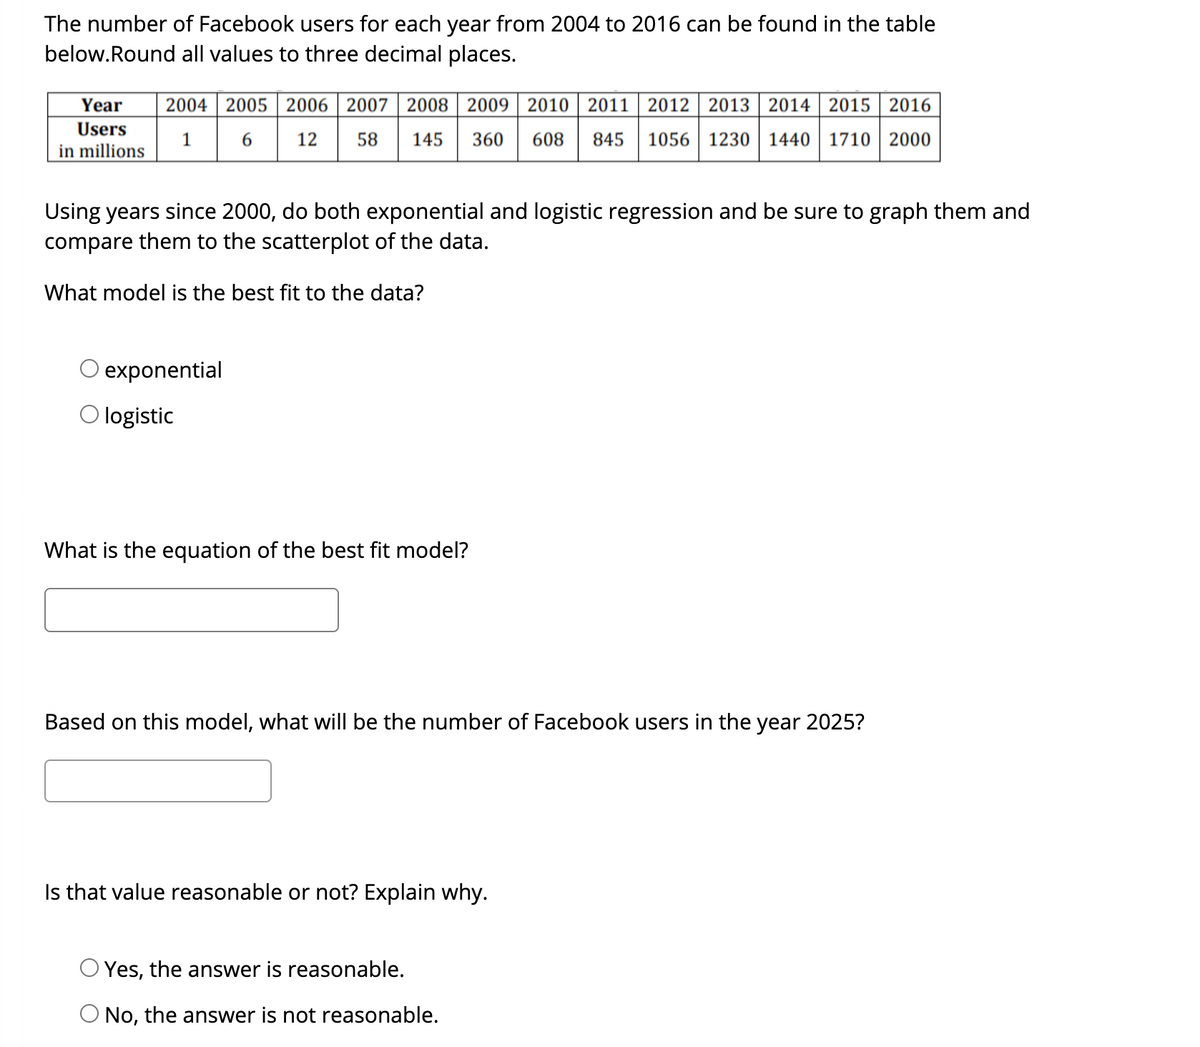
Transcribed Image Text:The number of Facebook users for each year from 2004 to 2016 can be found in the table
below.Round all values to three decimal places.
Year
2004 2005 2006 | 2007 | 2008 || 2009 | 2010
2011
2012 | 2013 2014 | 2015 | 2016
Users
1
in millions
58
145
1056 1230
6.
12
360
608
845
1440 1710 2000
Using years since 2000, do both exponential and logistic regression and be sure to graph them and
compare them to the scatterplot of the data.
What model is the best fit to the data?
exponential
O logistic
What is the equation of the best fit model?
Based on this model, what will be the number of Facebook users in the year 2025?
Is that value reasonable or not? Explain why.
O Yes, the answer is reasonable.
O No, the answer is not reasonable.
Expert Solution
This question has been solved!
Explore an expertly crafted, step-by-step solution for a thorough understanding of key concepts.

This is a popular solution!

Trending now
This is a popular solution!

Step by step
Solved in 3 steps with 6 images

Knowledge Booster


Learn more about
Need a deep-dive on the concept behind this application? Look no further. Learn more about this topic, advanced-math and related others by exploring similar questions and additional content below.Recommended textbooks for you

Linear Algebra: A Modern Introduction
Algebra
ISBN:
9781285463247
Author:
David Poole
Publisher:
Cengage Learning

Functions and Change: A Modeling Approach to Coll…
Algebra
ISBN:
9781337111348
Author:
Bruce Crauder, Benny Evans, Alan Noell
Publisher:
Cengage Learning
Linear Algebra: A Modern Introduction
Algebra
ISBN:
9781285463247
Author:
David Poole
Publisher:
Cengage Learning
Functions and Change: A Modeling Approach to Coll…
Algebra
ISBN:
9781337111348
Author:
Bruce Crauder, Benny Evans, Alan Noell
Publisher:
Cengage Learning

Algebra & Trigonometry with Analytic Geometry
Algebra
ISBN:
9781133382119
Author:
Swokowski
Publisher:
Cengage

College Algebra (MindTap Course List)
Algebra
ISBN:
9781305652231
Author:
R. David Gustafson, Jeff Hughes
Publisher:
Cengage Learning