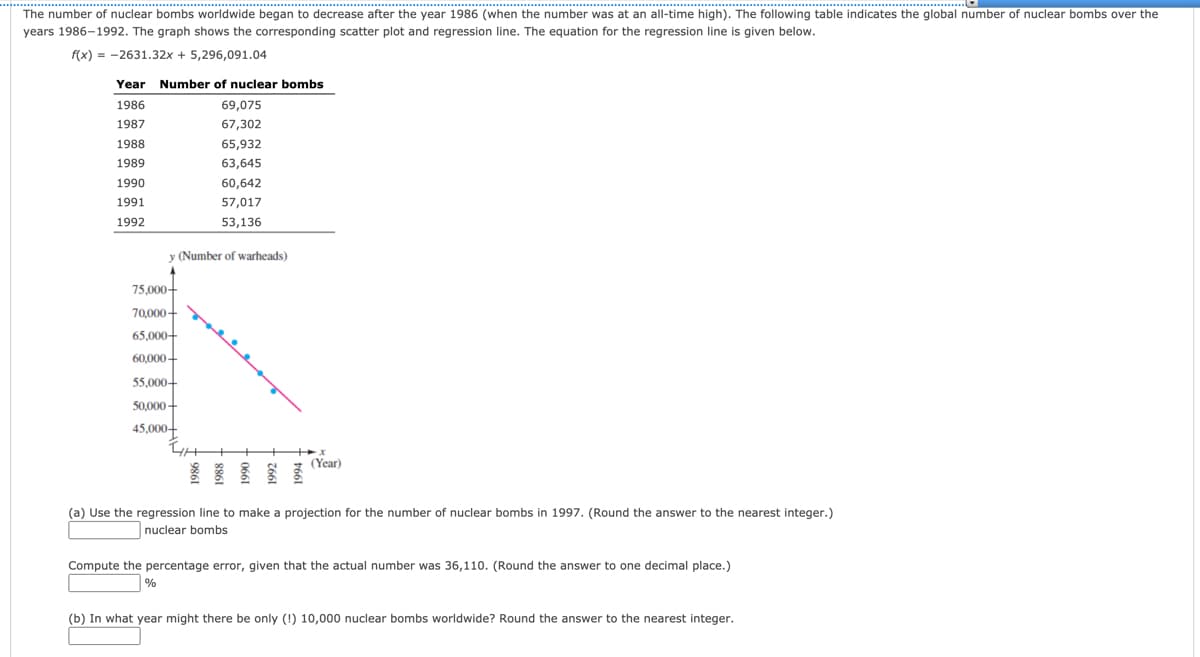
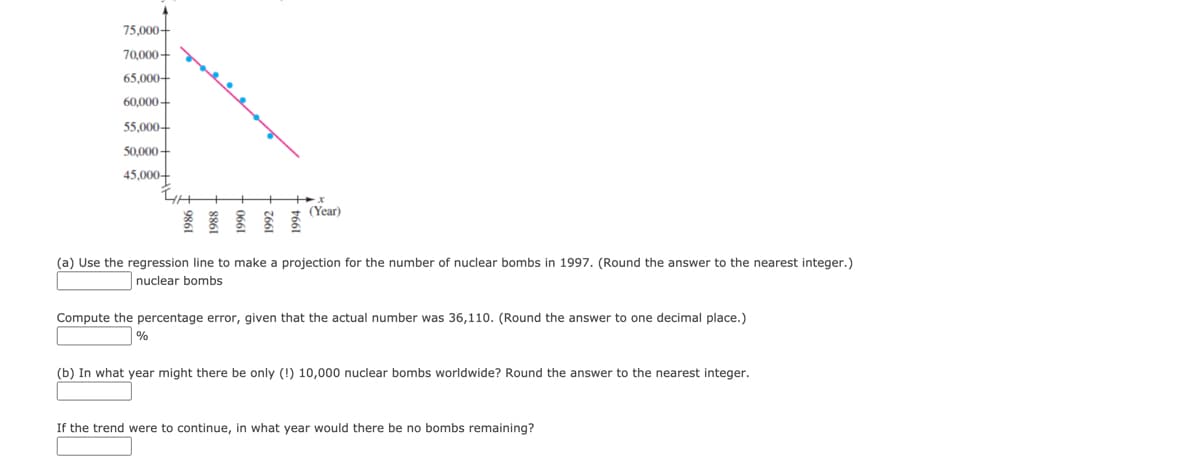
The number of nuclear bombs worldwide began to decrease after the year 1986 (when the number was at an all-time high). The following table indicates the global number of nuclear bombs over the years 1986-1992. The graph shows the corresponding scatter plot and regression line. The equation for the regression line is given below. f(x) = -2631.32x + 5,296,091.04 Year Number of nuclear bombs 1986 69,075 1987 67,302 1988 65,932 1989 63,645 1990 60,642 1991 57,017 1992 53,136 y (Number of warheads) 75,000- 70,000- 65,000- 60,000+ 55,000- 50,000+ 45,000- (Year) (a) Use the regression line to make a projection for the number of nuclear bombs in 1997. (Round the answer to the nearest integer.) nuclear bombs Compute the percentage error, given that the actual number was 36,110. (Round the answer to one decimal place.) (b) In what year might there be only (!) 10,000 nuclear bombs worldwide? Round the answer to the nearest integer.


Correlation
Correlation defines a relationship between two independent variables. It tells the degree to which variables move in relation to each other. When two sets of data are related to each other, there is a correlation between them.
Linear Correlation
A correlation is used to determine the relationships between numerical and categorical variables. In other words, it is an indicator of how things are connected to one another. The correlation analysis is the study of how variables are related.
Regression Analysis
Regression analysis is a statistical method in which it estimates the relationship between a dependent variable and one or more independent variable. In simple terms dependent variable is called as outcome variable and independent variable is called as predictors. Regression analysis is one of the methods to find the trends in data. The independent variable used in Regression analysis is named Predictor variable. It offers data of an associated dependent variable regarding a particular outcome.

Step by step
Solved in 2 steps with 2 images


