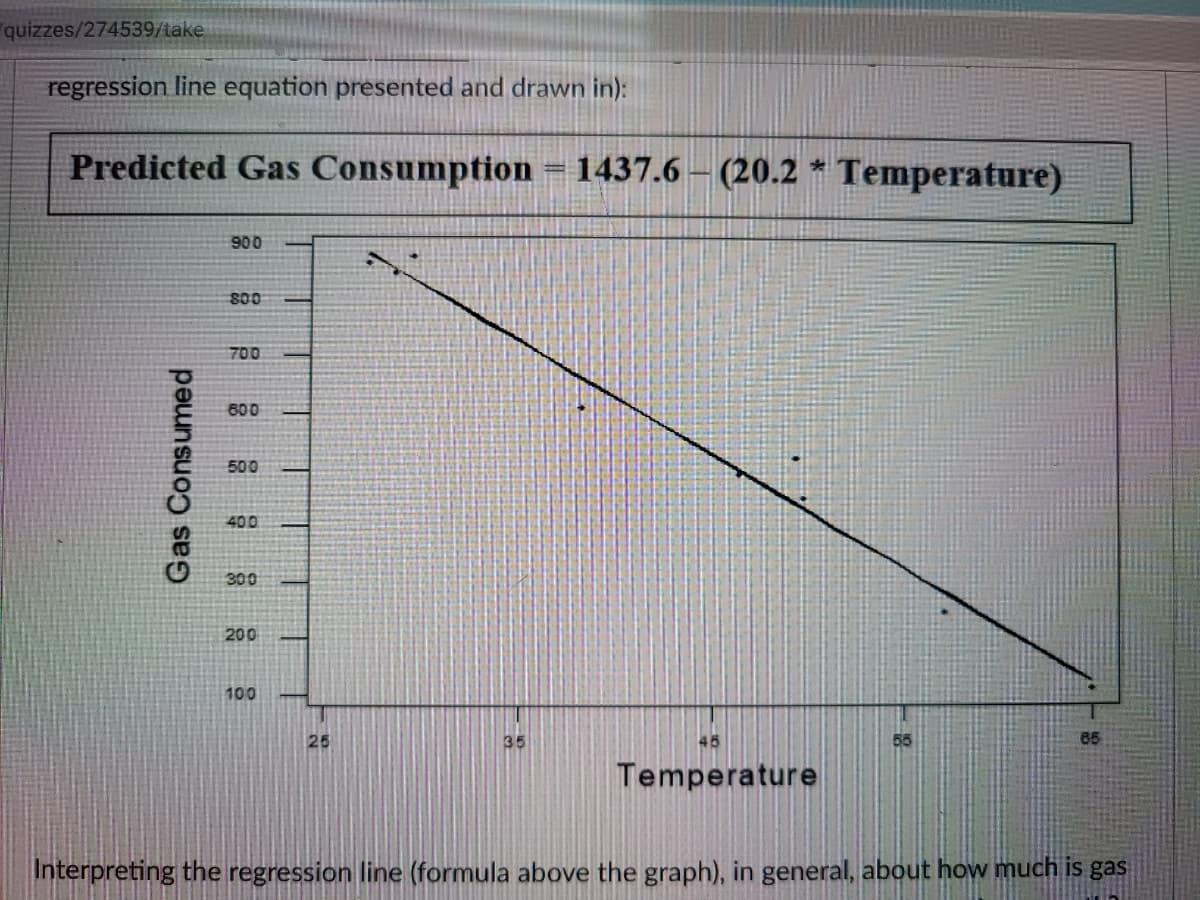
For nine months, Joan observes the average daily gas consumption for her house and the corresponding average temperature that month. She gets the following scatterplot (with regression line equation presented and drawn in): After collecting the data, Joan had insulation installed in her home. The next month, the average temperature was 30 and her home (with insulation) consumed 682 gas daily. Approximately how much gas did the insulation save her daily that month? Which of the terms does apply to the relationship between temperature and gas consumed?


Correlation
Correlation defines a relationship between two independent variables. It tells the degree to which variables move in relation to each other. When two sets of data are related to each other, there is a correlation between them.
Linear Correlation
A correlation is used to determine the relationships between numerical and categorical variables. In other words, it is an indicator of how things are connected to one another. The correlation analysis is the study of how variables are related.
Regression Analysis
Regression analysis is a statistical method in which it estimates the relationship between a dependent variable and one or more independent variable. In simple terms dependent variable is called as outcome variable and independent variable is called as predictors. Regression analysis is one of the methods to find the trends in data. The independent variable used in Regression analysis is named Predictor variable. It offers data of an associated dependent variable regarding a particular outcome.


Trending now
This is a popular solution!

Step by step
Solved in 2 steps


