The percent of fat calories that a person in America consumes each day is normally distributed with a mean of about 36 and a standard deviation of 10. Suppose that one individual is randomly chosen. Let X percent of fat calories. (a) Find the z-score corresponding to 31 percent of fat calories, rounded to 3 decimal places. (b) Find the probability that the percent of fat calories a person consumes is more than 31. (c) Shade the area corresponding to this probability in the graph below. (Hint: The x-axis is the z- score. Use your z-score from part (a), rounded to one decimal place). Shade: Left of a value v. Click and drag the arrows to adjust the values.
The percent of fat calories that a person in America consumes each day is normally distributed with a mean of about 36 and a standard deviation of 10. Suppose that one individual is randomly chosen. Let X percent of fat calories. (a) Find the z-score corresponding to 31 percent of fat calories, rounded to 3 decimal places. (b) Find the probability that the percent of fat calories a person consumes is more than 31. (c) Shade the area corresponding to this probability in the graph below. (Hint: The x-axis is the z- score. Use your z-score from part (a), rounded to one decimal place). Shade: Left of a value v. Click and drag the arrows to adjust the values.

MATLAB: An Introduction with Applications
6th Edition
ISBN:9781119256830
Author:Amos Gilat
Publisher:Amos Gilat
Chapter1: Starting With Matlab
Section: Chapter Questions
Problem 1P

Related questions
Question
Transcribed Image Text:Skip/15
• Question 15
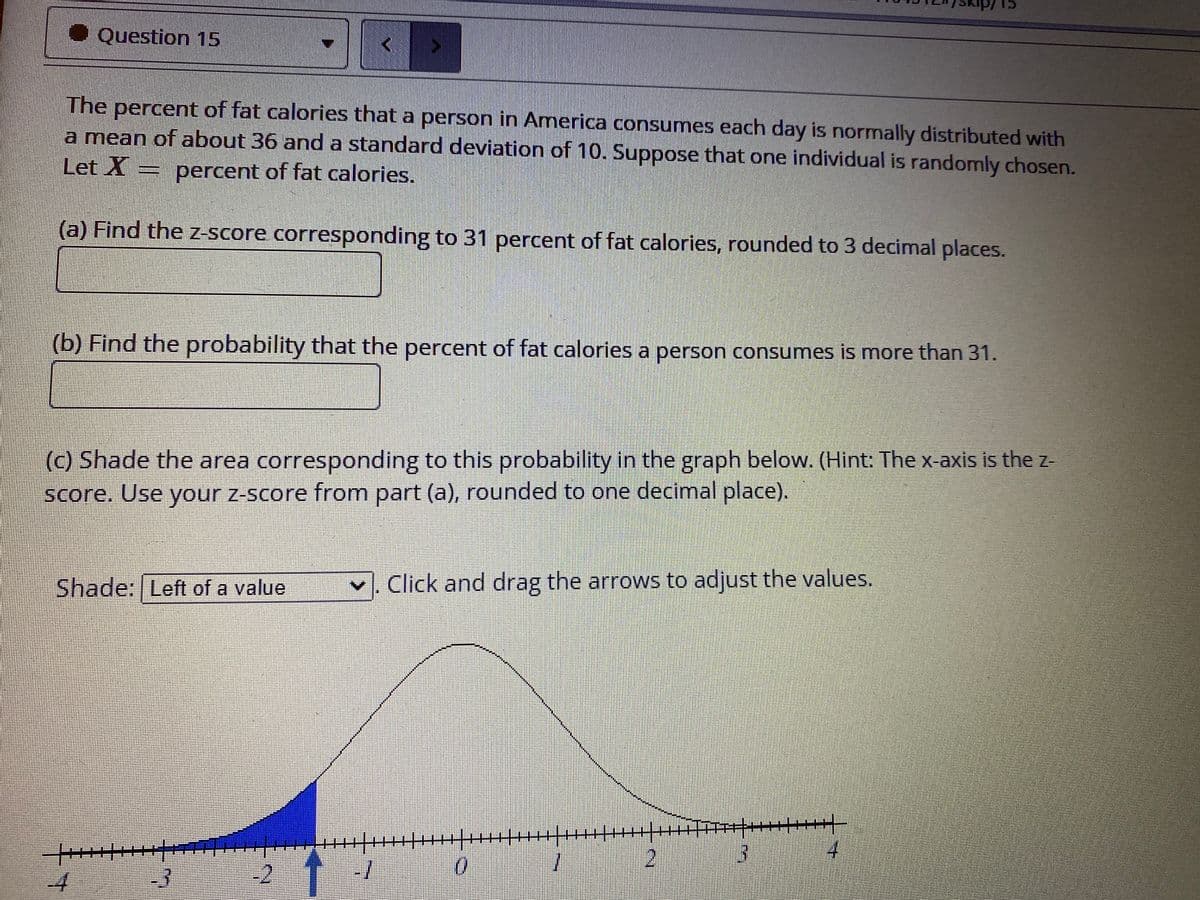
The percent of fat calories that a person in America consumes each day is normally distributed with
a mean of about 36 and a standard deviation of 10. Suppose that one individual is randomly chosen.
Let X = percent of fat calories.
(a) Find the z-Score corresponding to 31 percent of fat calories, rounded to 3 decimal places.
(b) Find the probability that the percent of fat calories a person consumes is more than 31.
(c) Shade the area corresponding to this probability in the graph below. (Hint: The x-axis is the z-
score. Use your z-score from part (a), rounded to one decimal place).
Shade: Left of a value
v, Click and drag the arrows to adjust the values.
2
4.
-4
-3
-2
Expert Solution
This question has been solved!
Explore an expertly crafted, step-by-step solution for a thorough understanding of key concepts.

This is a popular solution!

Trending now
This is a popular solution!

Step by step
Solved in 4 steps with 1 images

Recommended textbooks for you
MATLAB: An Introduction with Applications
Statistics
ISBN:
9781119256830
Author:
Amos Gilat
Publisher:
John Wiley & Sons Inc

Probability and Statistics for Engineering and th…
Statistics
ISBN:
9781305251809
Author:
Jay L. Devore
Publisher:
Cengage Learning

Statistics for The Behavioral Sciences (MindTap C…
Statistics
ISBN:
9781305504912
Author:
Frederick J Gravetter, Larry B. Wallnau
Publisher:
Cengage Learning
MATLAB: An Introduction with Applications
Statistics
ISBN:
9781119256830
Author:
Amos Gilat
Publisher:
John Wiley & Sons Inc
Probability and Statistics for Engineering and th…
Statistics
ISBN:
9781305251809
Author:
Jay L. Devore
Publisher:
Cengage Learning
Statistics for The Behavioral Sciences (MindTap C…
Statistics
ISBN:
9781305504912
Author:
Frederick J Gravetter, Larry B. Wallnau
Publisher:
Cengage Learning

Elementary Statistics: Picturing the World (7th E…
Statistics
ISBN:
9780134683416
Author:
Ron Larson, Betsy Farber
Publisher:
PEARSON

The Basic Practice of Statistics
Statistics
ISBN:
9781319042578
Author:
David S. Moore, William I. Notz, Michael A. Fligner
Publisher:
W. H. Freeman

Introduction to the Practice of Statistics
Statistics
ISBN:
9781319013387
Author:
David S. Moore, George P. McCabe, Bruce A. Craig
Publisher:
W. H. Freeman