The percentages of police officers who are women are listed in the table for various čity populations. City Population Used to Represent City Population (In thousands) Percent City Populatio (In thousands) 8.3 0-9.999 7.5 10-24.999 17.5 8.5 25-49.999 37.5 9.4 50-99.999 75 11.7 100-249.999 175 17 250 or more 300 Source: FBI Uniform Crime Report Let f(n) be the percentage of police officers who are women in cities with populations of n thousand. A model of the situation is f(n) = 0.000067n² + 0.012n + 7.884. Use a graphing calculator to draw the graph of the model and, in the same viewing window, the scattergram of the data. Does the model fit the data well? O The function is a good model for the data. O The function is not a good model for the data Glen Ellyn, Illinois, has a population of 122.08 thousand. Estimate the percentage of police officers in Glen Ellyn who are women.
The percentages of police officers who are women are listed in the table for various čity populations. City Population Used to Represent City Population (In thousands) Percent City Populatio (In thousands) 8.3 0-9.999 7.5 10-24.999 17.5 8.5 25-49.999 37.5 9.4 50-99.999 75 11.7 100-249.999 175 17 250 or more 300 Source: FBI Uniform Crime Report Let f(n) be the percentage of police officers who are women in cities with populations of n thousand. A model of the situation is f(n) = 0.000067n² + 0.012n + 7.884. Use a graphing calculator to draw the graph of the model and, in the same viewing window, the scattergram of the data. Does the model fit the data well? O The function is a good model for the data. O The function is not a good model for the data Glen Ellyn, Illinois, has a population of 122.08 thousand. Estimate the percentage of police officers in Glen Ellyn who are women.

Glencoe Algebra 1, Student Edition, 9780079039897, 0079039898, 2018
18th Edition
ISBN:9780079039897
Author:Carter
Publisher:Carter
Chapter10: Statistics
Section10.6: Summarizing Categorical Data
Problem 26PPS

Related questions

Concept explainers
Contingency Table
A contingency table can be defined as the visual representation of the relationship between two or more categorical variables that can be evaluated and registered. It is a categorical version of the scatterplot, which is used to investigate the linear relationship between two variables. A contingency table is indeed a type of frequency distribution table that displays two variables at the same time.
Binomial Distribution
Binomial is an algebraic expression of the sum or the difference of two terms. Before knowing about binomial distribution, we must know about the binomial theorem.
Topic Video
Question
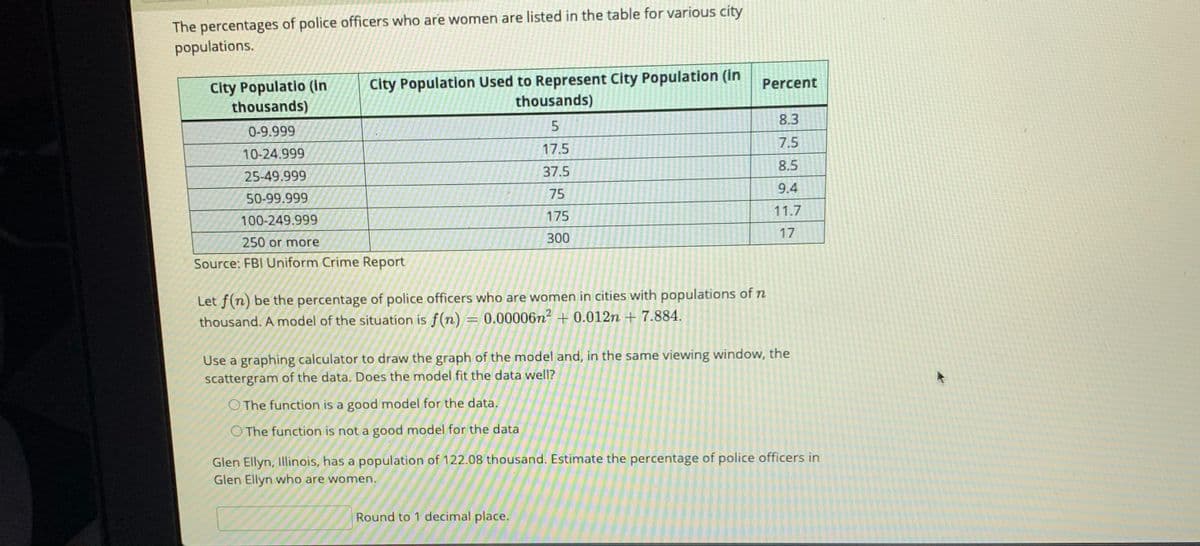
Transcribed Image Text:The percentages of police officers who are women are listed in the table for various city
populations.
City Populatio (in
thousands)
City Population Used to Represent City Population (in
thousands)
Percent
8.3
0-9.999
7.5
17.5
10-24.999
8.5
25-49.999
37.5
9.4
50-99.999
75
11.7
100-249.999
175
300
17
250 or more
Source: FBI Uniform Crime Report
Let f(n) be the percentage of police officers who are women in cities with populations of n
thousand. A model of the situation is f(n)
0.00006n? + 0.012n + 7.884.
Use a graphing calculator to draw the graph of the model and, in the same viewing window, the
scattergram of the data. Does the model fit the data well?
O The function is a good model for the data.
O The function is not a good model for the data
Glen Ellyn, Illinois, has a population of 122.08 thousand. Estimate the percentage of police officers in
Glen Ellyn who are women.
Round to 1 decimal place.
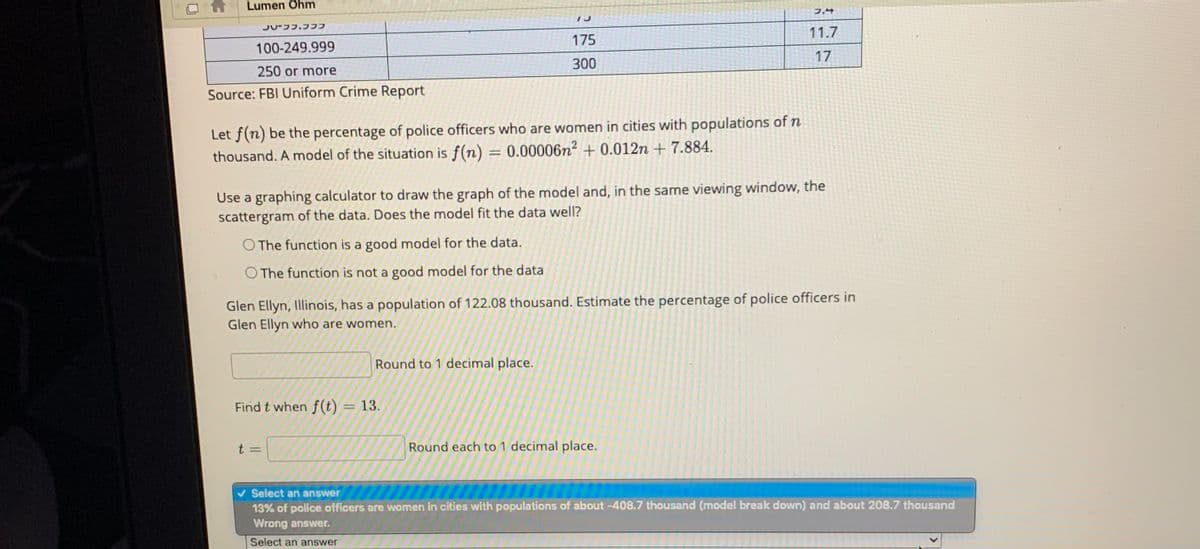
Transcribed Image Text:Lumen Öhm
フー
JUフフ、フフフ
11.7
175
100-249.999
17
300
250 or more
Source: FBI Uniform Crime Report
Let f(n) be the percentage of police officers who are women in cities with populations of n
thousand. A model of the situation is f(n) = 0.00006n2 + 0.012n + 7.884.
Use a graphing calculator to draw the graph of the model and, in the same viewing window, the
scattergram of the data. Does the model fit the data well?
O The function is a good model for the data.
O The function is not a good model for the data
Glen Ellyn, Illinois, has a population of 122.08 thousand. Estimate the percentage of police officers in
Glen Ellyn who are women.
Round to 1 decimal place.
Find t when f (t) = 13.
%3D
t =
Round each to 1 decimal place.
Select an answer
13% of police officers are women in cities with populations of about -408.7 thousand (model break down) and about 208.7 thousand
Wrong answer.
Select an answer
Expert Solution
This question has been solved!
Explore an expertly crafted, step-by-step solution for a thorough understanding of key concepts.

This is a popular solution!

Trending now
This is a popular solution!

Step by step
Solved in 3 steps with 1 images

Knowledge Booster


Learn more about
Need a deep-dive on the concept behind this application? Look no further. Learn more about this topic, advanced-math and related others by exploring similar questions and additional content below.Recommended textbooks for you
Glencoe Algebra 1, Student Edition, 9780079039897…
Algebra
ISBN:
9780079039897
Author:
Carter
Publisher:
McGraw Hill

Holt Mcdougal Larson Pre-algebra: Student Edition…
Algebra
ISBN:
9780547587776
Author:
HOLT MCDOUGAL
Publisher:
HOLT MCDOUGAL
Glencoe Algebra 1, Student Edition, 9780079039897…
Algebra
ISBN:
9780079039897
Author:
Carter
Publisher:
McGraw Hill
Holt Mcdougal Larson Pre-algebra: Student Edition…
Algebra
ISBN:
9780547587776
Author:
HOLT MCDOUGAL
Publisher:
HOLT MCDOUGAL