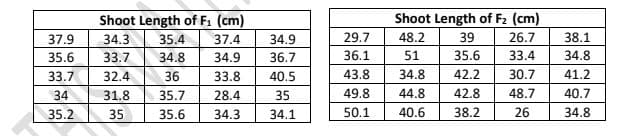
The phenotypic data below are the shoot lengths of 25 F1 and 25 F2 rice plants atseedling stage, produced from the cross of IR29 and Hasawi rice varieties. The mean lengths of the shoot from IR29 and Hasawi are 23.1 cm and 46.7 cm, respectively. Tabulate and plot the frequency distributions of the F1 and F2 generations. From each distribution calculate the mean, the variance,and the standard error of the mean. What is the main difference between F1 and F2 distributions? Formulas needed: Range (R) = maximum – minimum (Use the same no. of decimal places as original data.) No. of phenotypic classes (K) = 1 + 3.3logn (Round up answer to an integer. Number may still be increased or decreased as needed.) n = total no. of values Class interval (CI) = R/K (Use the same no. of decimal places as original data.)


The
Formulas needed:
Range (R) = maximum – minimum (Use the same no. of decimal places as original data.)
No. of phenotypic classes (K) = 1 + 3.3logn (Round up answer to an integer. Number may still be increased or decreased as needed.)
n = total no. of values
Class interval (CI) = R/K (Use the same no. of decimal places as original data.)


Trending now
This is a popular solution!

Step by step
Solved in 2 steps with 1 images


