The possible samples with mean tenure are 12, 14, 6, 19,12 S.No. Sample (12. 14) Sample mean 13
The possible samples with mean tenure are 12, 14, 6, 19,12 S.No. Sample (12. 14) Sample mean 13

MATLAB: An Introduction with Applications
6th Edition
ISBN:9781119256830
Author:Amos Gilat
Publisher:Amos Gilat
Chapter1: Starting With Matlab
Section: Chapter Questions
Problem 1P

Related questions
Question
The image with the table is the answer to question 3.
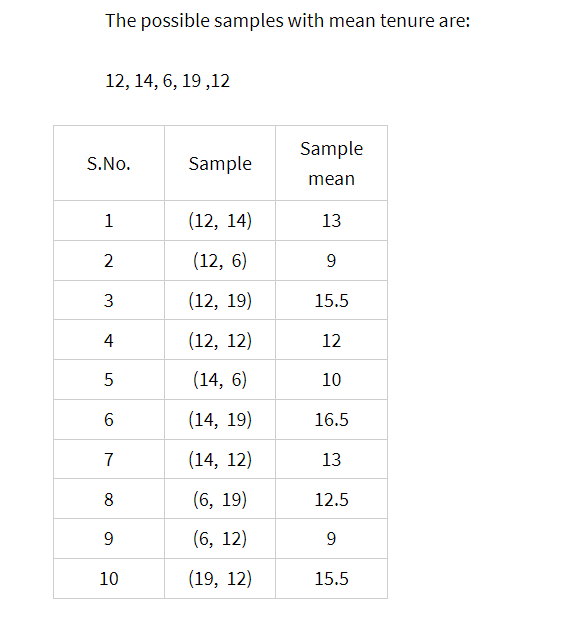
Transcribed Image Text:The possible samples with mean tenure are:
12, 14, 6, 19,12
S.No.
1
2
3
4
5
6
7
8
9
10
Sample
(12, 14)
(12, 6)
(12, 19)
(12, 12)
(14, 6)
(14, 19)
(14, 12)
(6, 19)
(6, 12)
(19, 12)
Sample
mean
13
9
15.5
12
10
16.5
13
12.5
9
15.5
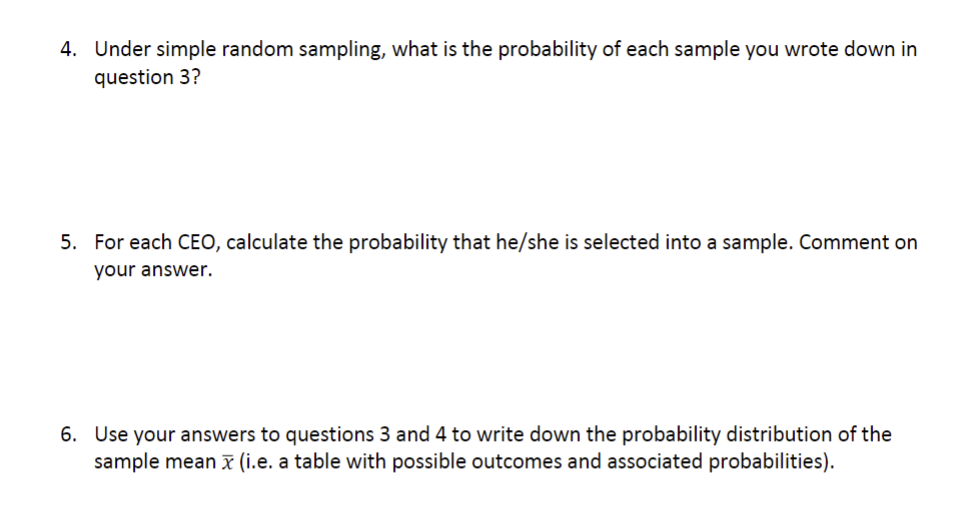
Transcribed Image Text:4. Under simple random sampling, what is the probability of each sample you wrote down in
question 3?
5. For each CEO, calculate the probability that he/she is selected into a sample. Comment on
your answer.
6. Use your answers to questions 3 and 4 to write down the probability distribution of the
sample mean x (i.e. a table with possible outcomes and associated probabilities).
Expert Solution
This question has been solved!
Explore an expertly crafted, step-by-step solution for a thorough understanding of key concepts.

Step by step
Solved in 3 steps with 21 images

Follow-up Questions
Read through expert solutions to related follow-up questions below.
Follow-up Question

Transcribed Image Text:7. Calculate the expected value of x. How does your answer compare to the population mean
of tenure?
8. Suppose that you sampled 2 CEOs with replacement instead. How many different samples
are possible, and what is the probability of each sample occurring?
Solution
Recommended textbooks for you
MATLAB: An Introduction with Applications
Statistics
ISBN:
9781119256830
Author:
Amos Gilat
Publisher:
John Wiley & Sons Inc

Probability and Statistics for Engineering and th…
Statistics
ISBN:
9781305251809
Author:
Jay L. Devore
Publisher:
Cengage Learning

Statistics for The Behavioral Sciences (MindTap C…
Statistics
ISBN:
9781305504912
Author:
Frederick J Gravetter, Larry B. Wallnau
Publisher:
Cengage Learning
MATLAB: An Introduction with Applications
Statistics
ISBN:
9781119256830
Author:
Amos Gilat
Publisher:
John Wiley & Sons Inc
Probability and Statistics for Engineering and th…
Statistics
ISBN:
9781305251809
Author:
Jay L. Devore
Publisher:
Cengage Learning
Statistics for The Behavioral Sciences (MindTap C…
Statistics
ISBN:
9781305504912
Author:
Frederick J Gravetter, Larry B. Wallnau
Publisher:
Cengage Learning

Elementary Statistics: Picturing the World (7th E…
Statistics
ISBN:
9780134683416
Author:
Ron Larson, Betsy Farber
Publisher:
PEARSON

The Basic Practice of Statistics
Statistics
ISBN:
9781319042578
Author:
David S. Moore, William I. Notz, Michael A. Fligner
Publisher:
W. H. Freeman

Introduction to the Practice of Statistics
Statistics
ISBN:
9781319013387
Author:
David S. Moore, George P. McCabe, Bruce A. Craig
Publisher:
W. H. Freeman