The poverty rates for white and blacks in the U.S were compared for a period of twelve years with the following results. White 9.1 9.7 9.6 8.8 8 6.9 6.9 7 7.1 7.7 6.8 7 Black 30.9 32.4 33 30.8 28.9 27.8 27.5 28.2 27.9 27.1 26.9 27.8 a. Treat poverty rate for whites as the independent variable. Determine the sample correlation coefficient. What does this say about the direction of the relationship and what does that mean? b. Determine the least squares line for these data. c. What is the slope of the least squares line and what does it mean in this situation? d. If the poverty rate for whites is 7.5, what would you expect the poverty rate for blacks would be? e. If the poverty rate for blacks is 30, what would you expect the poverty rate for whites would be? g Explain why it may not be appropriate to predict the black poverty rate when the white poverty rate is 12.
The poverty rates for white and blacks in the U.S were compared for a period of twelve years with the following results. White 9.1 9.7 9.6 8.8 8 6.9 6.9 7 7.1 7.7 6.8 7 Black 30.9 32.4 33 30.8 28.9 27.8 27.5 28.2 27.9 27.1 26.9 27.8 a. Treat poverty rate for whites as the independent variable. Determine the sample correlation coefficient. What does this say about the direction of the relationship and what does that mean? b. Determine the least squares line for these data. c. What is the slope of the least squares line and what does it mean in this situation? d. If the poverty rate for whites is 7.5, what would you expect the poverty rate for blacks would be? e. If the poverty rate for blacks is 30, what would you expect the poverty rate for whites would be? g Explain why it may not be appropriate to predict the black poverty rate when the white poverty rate is 12.

Glencoe Algebra 1, Student Edition, 9780079039897, 0079039898, 2018
18th Edition
ISBN:9780079039897
Author:Carter
Publisher:Carter
Chapter10: Statistics
Section10.5: Comparing Sets Of Data
Problem 13PPS

Related questions
Question
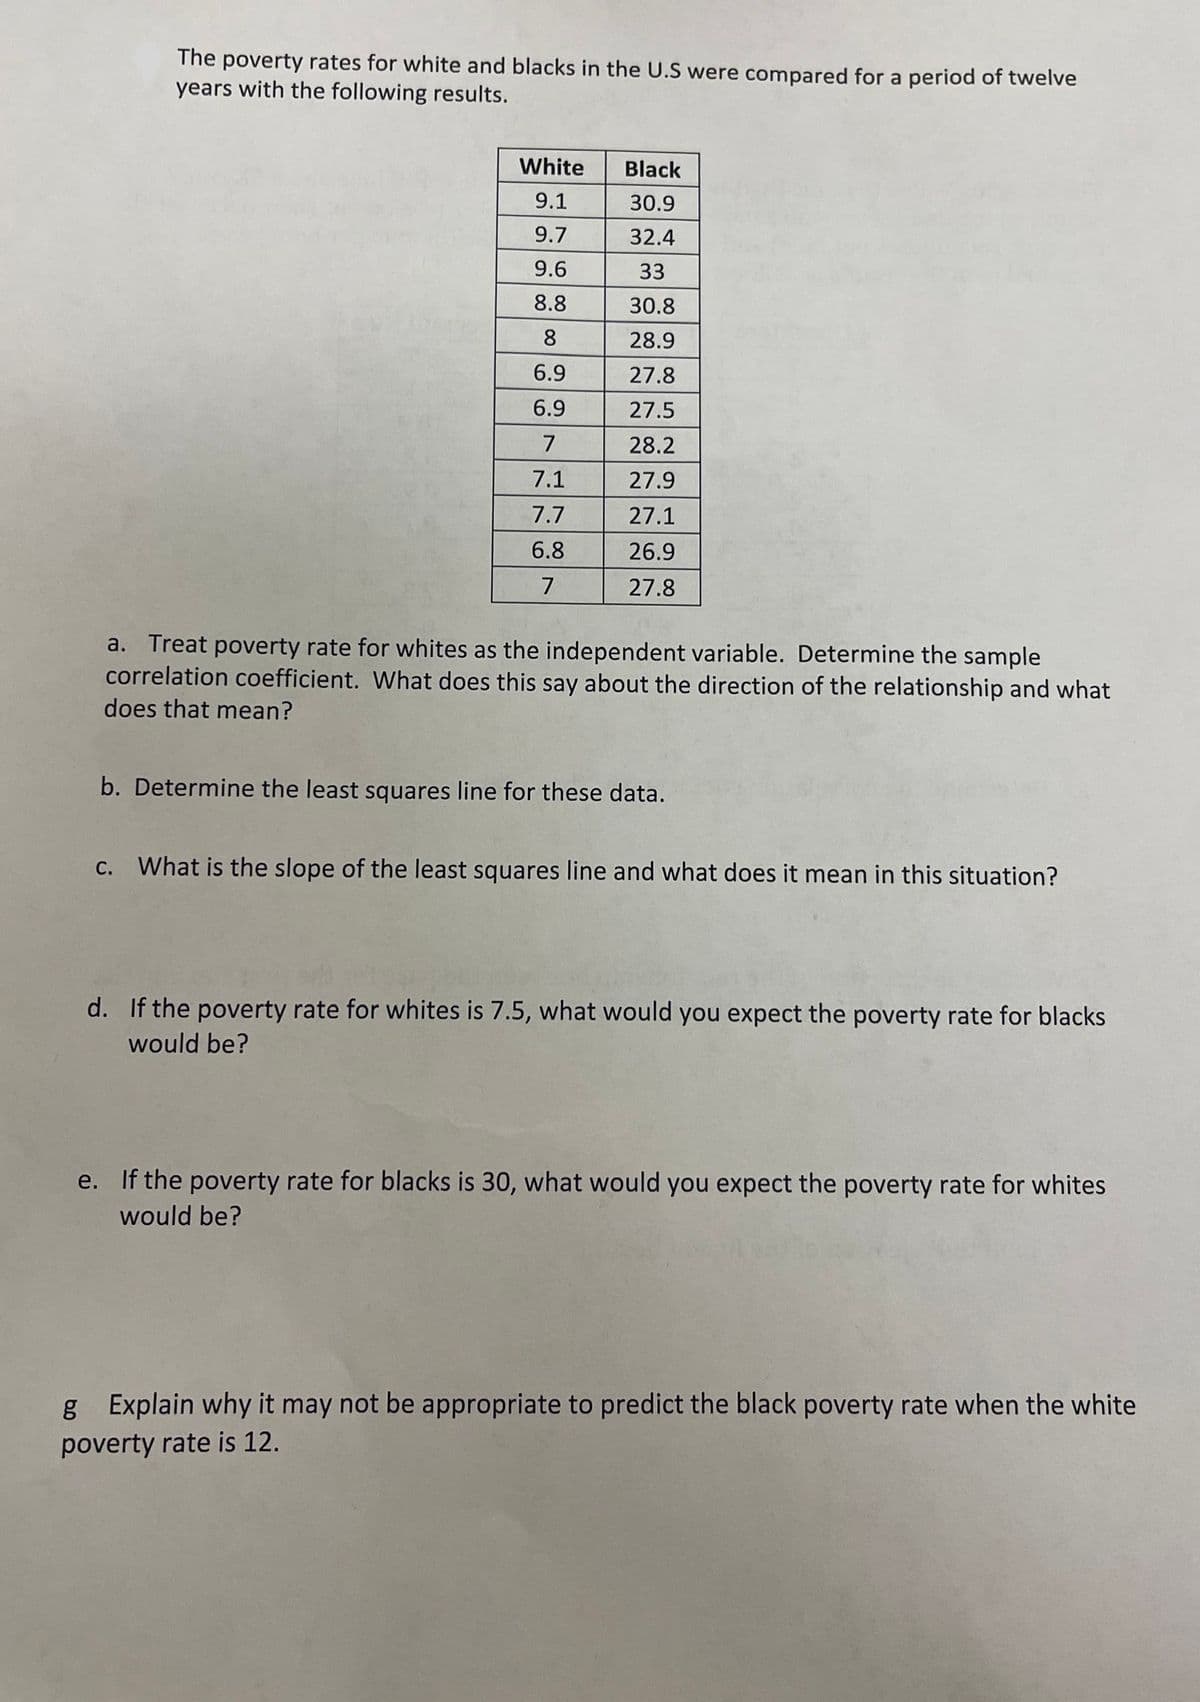
Transcribed Image Text:The poverty rates for white and blacks in the U.S were compared for a period of twelve
years with the following results.
White
9.1
9.7
9.6
8.8
8
6.9
6.9
7
7.1
7.7
6.8
7
Black
30.9
32.4
33
30.8
28.9
27.8
27.5
28.2
27.9
27.1
26.9
27.8
a. Treat poverty rate for whites as the independent variable. Determine the sample
correlation coefficient. What does this say about the direction of the relationship and what
does that mean?
b. Determine the least squares line for these data.
c. What is the slope of the least squares line and what does it mean in this situation?
d. If the poverty rate for whites is 7.5, what would you expect the poverty rate for blacks
would be?
e. If the poverty rate for blacks is 30, what would you expect the poverty rate for whites
would be?
g Explain why it may not be appropriate to predict the black poverty rate when the white
poverty rate is 12.
Expert Solution
This question has been solved!
Explore an expertly crafted, step-by-step solution for a thorough understanding of key concepts.

This is a popular solution!

Trending now
This is a popular solution!

Step by step
Solved in 4 steps with 9 images

Recommended textbooks for you
Glencoe Algebra 1, Student Edition, 9780079039897…
Algebra
ISBN:
9780079039897
Author:
Carter
Publisher:
McGraw Hill
Glencoe Algebra 1, Student Edition, 9780079039897…
Algebra
ISBN:
9780079039897
Author:
Carter
Publisher:
McGraw Hill