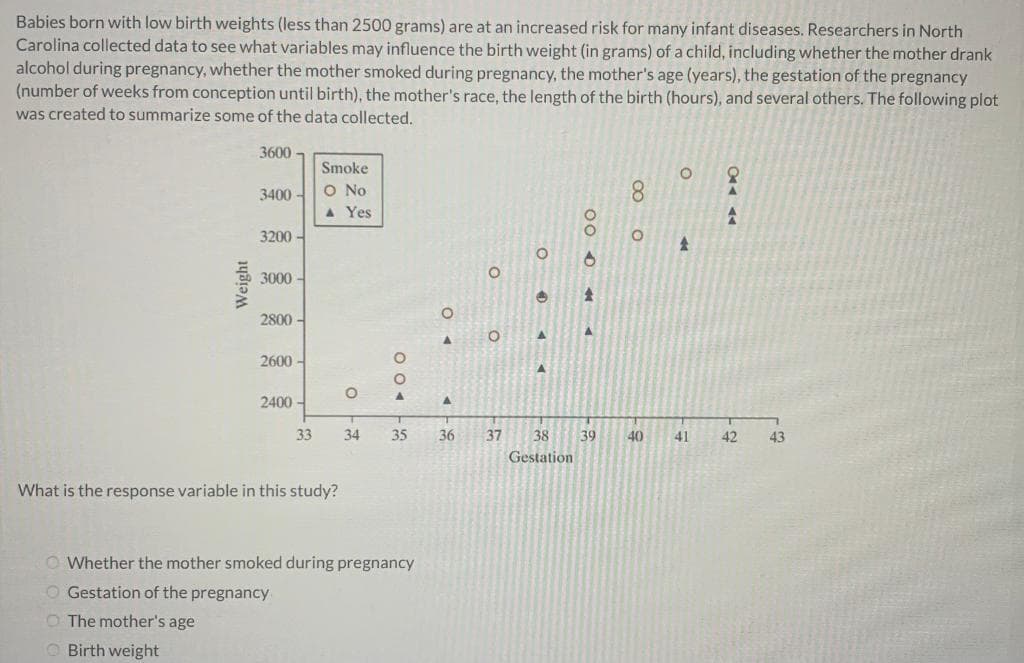
Babies born with low birth weights (less than 2500 grams) are at an increased risk for many infant diseases. Researchers in North Carolina collected data to see what variables may influence the birth weight (in grams) of a child, including whether the mother drank alcohol during pregnancy, whether the mother smoked during pregnancy, the mother's age (years), the gestation of the pregnancy (number of weeks from conception until birth), the mother's race, the length of the birth (hours), and several others. The following plot was created to summarize some of the data collected. Weight 3600 3400- 3200- 3000- 2800- 2600- 2400- Smoke O No A Yes O 004 O O O O 4 < 00 04 8 O O 2 CA A M
Babies born with low birth weights (less than 2500 grams) are at an increased risk for many infant diseases. Researchers in North Carolina collected data to see what variables may influence the birth weight (in grams) of a child, including whether the mother drank alcohol during pregnancy, whether the mother smoked during pregnancy, the mother's age (years), the gestation of the pregnancy (number of weeks from conception until birth), the mother's race, the length of the birth (hours), and several others. The following plot was created to summarize some of the data collected. Weight 3600 3400- 3200- 3000- 2800- 2600- 2400- Smoke O No A Yes O 004 O O O O 4 < 00 04 8 O O 2 CA A M

Functions and Change: A Modeling Approach to College Algebra (MindTap Course List)
6th Edition
ISBN:9781337111348
Author:Bruce Crauder, Benny Evans, Alan Noell
Publisher:Bruce Crauder, Benny Evans, Alan Noell
Chapter5: A Survey Of Other Common Functions
Section5.6: Higher-degree Polynomials And Rational Functions
Problem 5E: Population Genetics In the study of population genetics, an important measure of inbreeding is the...

Related questions
Question
(Please don't copy)
All solve the problem
Transcribed Image Text:Babies born with low birth weights (less than 2500 grams) are at an increased risk for many infant diseases. Researchers in North
Carolina collected data to see what variables may influence the birth weight (in grams) of a child, including whether the mother drank
alcohol during pregnancy, whether the mother smoked during pregnancy, the mother's age (years), the gestation of the pregnancy
(number of weeks from conception until birth), the mother's race, the length of the birth (hours), and several others. The following plot
was created to summarize some of the data collected.
3600
Smoke
O No
A Yes
3400
3200-
3000-
2800 -
2600
2400-
33
34
35
36
37
38
39
40
41
42
43
Gestation
What is the response variable in this study?
O Whether the mother smoked during pregnancy
O Gestation of the pregnancy
O The mother's age
O Birth weight
00
00 o
Weight
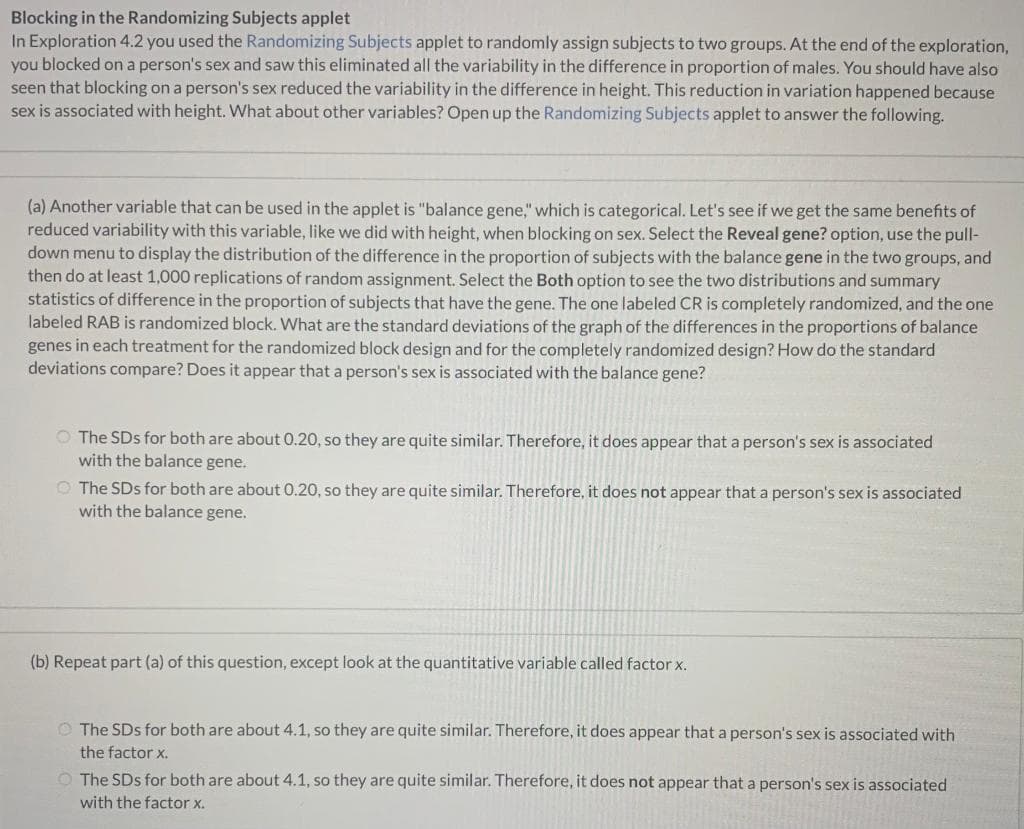
Transcribed Image Text:Blocking in the Randomizing Subjects applet
In Exploration 4.2 you used the Randomizing Subjects applet to randomly assign subjects to two groups. At the end of the exploration,
you blocked on a person's sex and saw this eliminated all the variability in the difference in proportion of males. You should have also
seen that blocking on a person's sex reduced the variability in the difference in height. This reduction in variation happened because
sex is associated with height. What about other variables? Open up the Randomizing Subjects applet to answer the following.
(a) Another variable that can be used in the applet is "balance gene," which is categorical. Let's see if we get the same benefits of
reduced variability with this variable, like we did with height, when blocking on sex. Select the Reveal gene? option, use the pull-
down menu to display the distribution of the difference in the proportion of subjects with the balance gene in the two groups, and
then do at least 1,000 replications of random assignment. Select the Both option to see the two distributions and summary
statistics of difference in the proportion of subjects that have the gene. The one labeled CR is completely randomized, and the one
labeled RAB is randomized block. What are the standard deviations of the graph of the differences in the proportions of balance
genes in each treatment for the randomized block design and for the completely randomized design? How do the standard
deviations compare? Does it appear that a person's sex is associated with the balance gene?
O The SDs for both are about 0.20, so they are quite similar. Therefore, it does appear that a person's sex is associated
with the balance gene.
O The SDs for both are about 0.20, so they are quite similar. Therefore, it does not appear that a person's sex is associated
with the balance gene.
(b) Repeat part (a) of this question, except look at the quantitative variable called factor x.
O The SDs for both are about 4.1, so they are quite similar. Therefore, it does appear that a person's sex is associated with
the factor x.
O The SDs for both are about 4.1, so they are quite similar. Therefore, it does not appear that a person's sex is associated
with the factor x.
Expert Solution
This question has been solved!
Explore an expertly crafted, step-by-step solution for a thorough understanding of key concepts.

This is a popular solution!

Trending now
This is a popular solution!

Step by step
Solved in 5 steps

Recommended textbooks for you
Functions and Change: A Modeling Approach to Coll…
Algebra
ISBN:
9781337111348
Author:
Bruce Crauder, Benny Evans, Alan Noell
Publisher:
Cengage Learning
Functions and Change: A Modeling Approach to Coll…
Algebra
ISBN:
9781337111348
Author:
Bruce Crauder, Benny Evans, Alan Noell
Publisher:
Cengage Learning