The predicting equation for the average live weight of the ewes using the proportion of land closed for the lambs before weaning is Y=23.496 +0.103X3. Which of the following is (are) TRUE? 1. The expected average live weight of the ewes when no area is closed for the lambs is 23.496 kg. II. The average live weight of the ewes is expected to decrease by 0.103 kg for every unit increase in the proportion of land closed for the lambs before weaning.
The predicting equation for the average live weight of the ewes using the proportion of land closed for the lambs before weaning is Y=23.496 +0.103X3. Which of the following is (are) TRUE? 1. The expected average live weight of the ewes when no area is closed for the lambs is 23.496 kg. II. The average live weight of the ewes is expected to decrease by 0.103 kg for every unit increase in the proportion of land closed for the lambs before weaning.

Glencoe Algebra 1, Student Edition, 9780079039897, 0079039898, 2018
18th Edition
ISBN:9780079039897
Author:Carter
Publisher:Carter
Chapter10: Statistics
Section10.6: Summarizing Categorical Data
Problem 31PPS

Related questions
Question
A survey on lamb farms was conducted and data were collected on the following
variables from a random sample of 30 farmers.
Y = average live weight of ewes (kg)
X1 = area of grazing land (m2)
X2 = proportion of farm area that cannot be cultivated
X3 = proportion of area closed for lambs before weaning
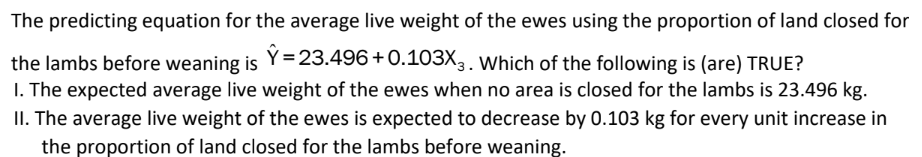
Transcribed Image Text:The predicting equation for the average live weight of the ewes using the proportion of land closed for
the lambs before weaning is Y=23.496+0.103X3. Which of the following is (are) TRUE?
1. The expected average live weight of the ewes when no area is closed for the lambs is 23.496 kg.
II. The average live weight of the ewes is expected to decrease by 0.103 kg for every unit increase in
the proportion of land closed for the lambs before weaning.
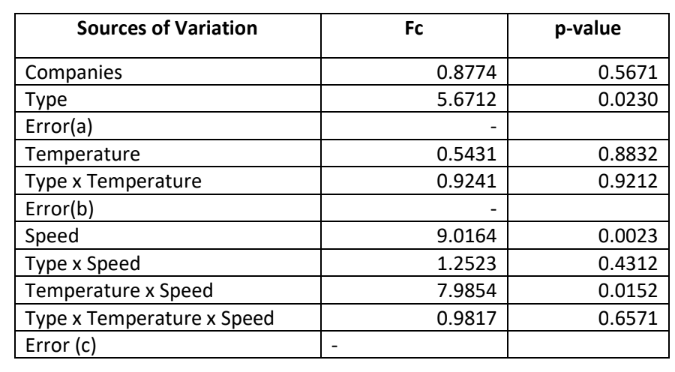
Transcribed Image Text:Sources of Variation
Companies
Type
Error(a)
Temperature
Type x Temperature
Error(b)
Speed
Type x Speed
Temperature x Speed
Type x Temperature x Speed
Error (c)
Fc
0.8774
5.6712
-
0.5431
0.9241
9.0164
1.2523
7.9854
0.9817
p-value
0.5671
0.0230
0.8832
0.9212
0.0023
0.4312
0.0152
0.6571
Expert Solution
This question has been solved!
Explore an expertly crafted, step-by-step solution for a thorough understanding of key concepts.

Step by step
Solved in 2 steps

Recommended textbooks for you
Glencoe Algebra 1, Student Edition, 9780079039897…
Algebra
ISBN:
9780079039897
Author:
Carter
Publisher:
McGraw Hill
Glencoe Algebra 1, Student Edition, 9780079039897…
Algebra
ISBN:
9780079039897
Author:
Carter
Publisher:
McGraw Hill