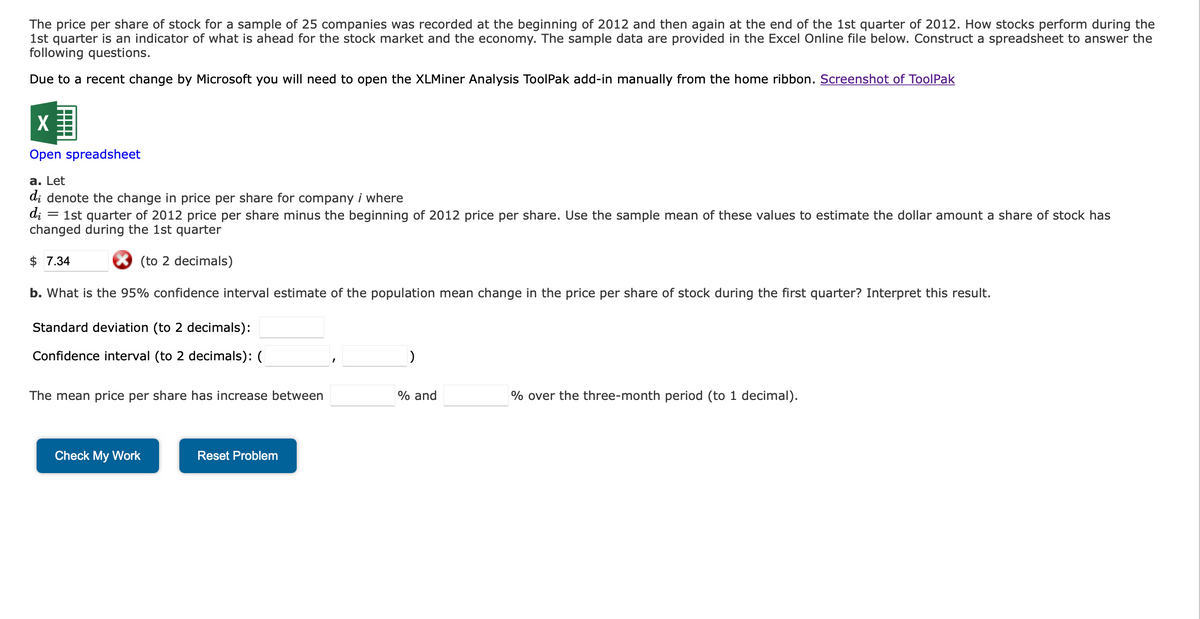
The price per share of stock for a sample of 25 companies was recorded at the beginning of 2012 and then again at the end of the 1st quarter of 2012. How stocks perform during the 1st quarter is an indicator of what is ahead for the stock market and the economy. The sample data are provided in the Excel Online file below. Construct a spreadsheet to answer the following questions. Due to a recent change by Microsoft you will need to open the XLMiner Analysis ToolPak add-in manually from the home ribbon. Screenshot of ToolPak Open spreadsheet a. Let di denote the change in price per share for company i where d; = 1st quarter of 2012 price per share minus the beginning of 2012 price per share. Use the sample mean of these values to estimate the dollar amount a share of stock has changed during the 1st quarter $7.34 (to 2 decimals) b. What is the 95% confidence interval estimate of the population mean change in the price per share of stock during the first quarter? Interpret this result. Standard deviation (to 2 decimals): Confidence interval (to 2 decimals): ( The mean price per share has increase between Check My Work Reset Problem ) % and % over the three-month period (to 1 decimal).
The price per share of stock for a sample of 25 companies was recorded at the beginning of 2012 and then again at the end of the 1st quarter of 2012. How stocks perform during the 1st quarter is an indicator of what is ahead for the stock market and the economy. The sample data are provided in the Excel Online file below. Construct a spreadsheet to answer the following questions. Due to a recent change by Microsoft you will need to open the XLMiner Analysis ToolPak add-in manually from the home ribbon. Screenshot of ToolPak Open spreadsheet a. Let di denote the change in price per share for company i where d; = 1st quarter of 2012 price per share minus the beginning of 2012 price per share. Use the sample mean of these values to estimate the dollar amount a share of stock has changed during the 1st quarter $7.34 (to 2 decimals) b. What is the 95% confidence interval estimate of the population mean change in the price per share of stock during the first quarter? Interpret this result. Standard deviation (to 2 decimals): Confidence interval (to 2 decimals): ( The mean price per share has increase between Check My Work Reset Problem ) % and % over the three-month period (to 1 decimal).

Glencoe Algebra 1, Student Edition, 9780079039897, 0079039898, 2018
18th Edition
ISBN:9780079039897
Author:Carter
Publisher:Carter
Chapter10: Statistics
Section10.3: Measures Of Spread
Problem 1GP

Related questions
Question
please provide CORRECT answers! Thank you.
Transcribed Image Text:File
015
1
2
3
4
5
6
7
8
9
10
11
12
13
14
15
16
17
18
19
20
21
22
23
24 ctric
25
26
27
28
29
30
son
on
Home
B
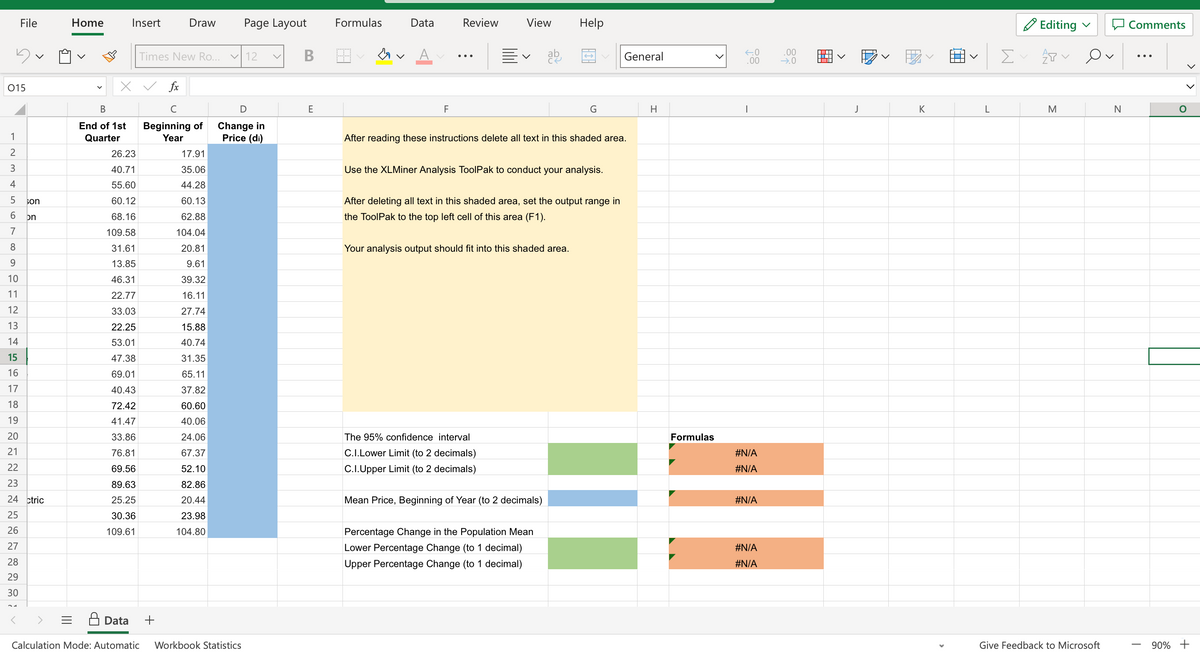
End of 1st
Quarter
Insert
x ✓ fx
26.23
40.71
55.60
60.12
68.16
109.58
31.61
13.85
46.31
22.77
33.03
22.25
53.01
47.38
69.01
40.43
72.42
41.47
33.86
76.81
69.56
89.63
25.25
30.36
109.61
Data
Draw
Times New Ro... ✓ 12
C
Beginning of
Year
+
17.91
35.06
44.28
60.13
62.88
104.04
20.81
9.61
39.32
16.11
27.74
15.88
40.74
31.35
65.11
37.82
60.60
40.06
24.06
67.37
52.10
82.86
20.44
23.98
104.80
Page Layout
D
Change in
Price (di)
Calculation Mode: Automatic Workbook Statistics
v
B
E
Formulas
Data
F
Review
View Help
v
The 95% confidence interval
C.I.Lower Limit (to 2 decimals)
C.I.Upper Limit (to 2 decimals)
ab
After reading these instructions delete all text in this shaded area.
Use the XLMiner Analysis ToolPak to conduct your analysis.
After deleting all text in this shaded area, set the output range in
the ToolPak to the top left cell of this area (F1).
Your analysis output should fit into this shaded area.
G
Mean Price, Beginning of Year (to 2 decimals)
Percentage Change in the Population Mean
Lower Percentage Change (to 1 decimal)
Upper Percentage Change (to 1 decimal)
General
H
Formulas
←0
.00
I
#N/A
#N/A
#N/A
#N/A
#N/A
.00
→.0
D
J
‒‒‒
K
L
Σ
Editing
会
M
Ov
Give Feedback to Microsoft
N
Comments
90% +
Transcribed Image Text:The price per share of stock for a sample of 25 companies was recorded at the beginning of 2012 and then again at the end of the 1st quarter of 2012. How stocks perform during the
1st quarter is an indicator of what is ahead for the stock market and the economy. The sample data are provided in the Excel Online file below. Construct a spreadsheet to answer the
following questions.
Due to a recent change by Microsoft you will need to open the XLMiner Analysis ToolPak add-in manually from the home ribbon. Screenshot of ToolPak
X
Open spreadsheet
a. Let
di denote the change in price per share for company i where
di
1st quarter of 2012 price per share minus the beginning of 2012 price per share. Use the sample mean of these values to estimate the dollar amount a share of stock has
changed during the 1st quarter
$ 7.34
(to 2 decimals)
b. What is the 95% confidence interval estimate of the population mean change in the price per share of stock during the first quarter? Interpret this result.
Standard deviation (to 2 decimals):
Confidence interval (to 2 decimals): (
=
The mean price per share has increase between
Check My Work
Reset Problem
)
% and
% over the three-month period (to 1 decimal).
Expert Solution
This question has been solved!
Explore an expertly crafted, step-by-step solution for a thorough understanding of key concepts.

This is a popular solution!
Step 1: Write the given information.
VIEWStep 2: Estimate the dollar amount a share of stock has changed during the 1st quarter.
VIEWStep 3: Determine the standard deviation and critical value required for 95% confidence interval.
VIEWStep 4: Determine the 95% confidence interval estimate of the population mean change in price per share.
VIEWSolution
VIEW
Trending now
This is a popular solution!

Step by step
Solved in 5 steps with 2 images

Recommended textbooks for you
Glencoe Algebra 1, Student Edition, 9780079039897…
Algebra
ISBN:
9780079039897
Author:
Carter
Publisher:
McGraw Hill

Holt Mcdougal Larson Pre-algebra: Student Edition…
Algebra
ISBN:
9780547587776
Author:
HOLT MCDOUGAL
Publisher:
HOLT MCDOUGAL

Big Ideas Math A Bridge To Success Algebra 1: Stu…
Algebra
ISBN:
9781680331141
Author:
HOUGHTON MIFFLIN HARCOURT
Publisher:
Houghton Mifflin Harcourt
Glencoe Algebra 1, Student Edition, 9780079039897…
Algebra
ISBN:
9780079039897
Author:
Carter
Publisher:
McGraw Hill
Holt Mcdougal Larson Pre-algebra: Student Edition…
Algebra
ISBN:
9780547587776
Author:
HOLT MCDOUGAL
Publisher:
HOLT MCDOUGAL
Big Ideas Math A Bridge To Success Algebra 1: Stu…
Algebra
ISBN:
9781680331141
Author:
HOUGHTON MIFFLIN HARCOURT
Publisher:
Houghton Mifflin Harcourt