The prices of Rawlston, Inc. stock (y) over a period of 12 days, the number of shares (in 100s) of the company's stocks sold (x1), and the volume of exchange (in millions) on the New York Stock Exchange (x2) are shown below. 1. Use Excel and write an equation that can be used to predict the price of the stock. 2. Interpret the coefficients of the estimated regression


Correlation
Correlation defines a relationship between two independent variables. It tells the degree to which variables move in relation to each other. When two sets of data are related to each other, there is a correlation between them.
Linear Correlation
A correlation is used to determine the relationships between numerical and categorical variables. In other words, it is an indicator of how things are connected to one another. The correlation analysis is the study of how variables are related.
Regression Analysis
Regression analysis is a statistical method in which it estimates the relationship between a dependent variable and one or more independent variable. In simple terms dependent variable is called as outcome variable and independent variable is called as predictors. Regression analysis is one of the methods to find the trends in data. The independent variable used in Regression analysis is named Predictor variable. It offers data of an associated dependent variable regarding a particular outcome.
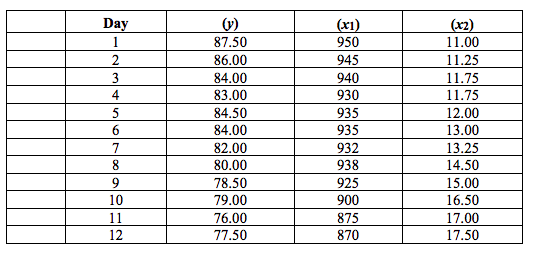
The prices of Rawlston, Inc. stock (y) over a period of 12 days, the number of shares (in 100s) of the company's stocks sold (x1), and the volume of exchange (in millions) on the New York Stock Exchange (x2) are shown below.
1. Use Excel and write an equation that can be used to predict the price of the stock.
2. Interpret the coefficients of the estimated regression equation that you found in part (1).
3. Perform a t test and determine whether independent variable and dependent variable are related. Fully interpret the meaning. Use α = .05.
4. Perform an F test and determine whether independent variable and dependent variable are related. Fully interpret the meaning. Use α = .05
5. Conduct Residual Analysis and fully interpret the meaning.
6. If on a given day, the number of shares of the company that were sold was 94,500 and the volume of exchange on the New York Stock Exchange was 10 million, what would you expect the price of the stock to be?
7. Submit Excel document with steps to support your answers above.
GRAPH IS PROVIDED BELOW! THANK YOU!!


Trending now
This is a popular solution!

Step by step
Solved in 3 steps with 1 images


