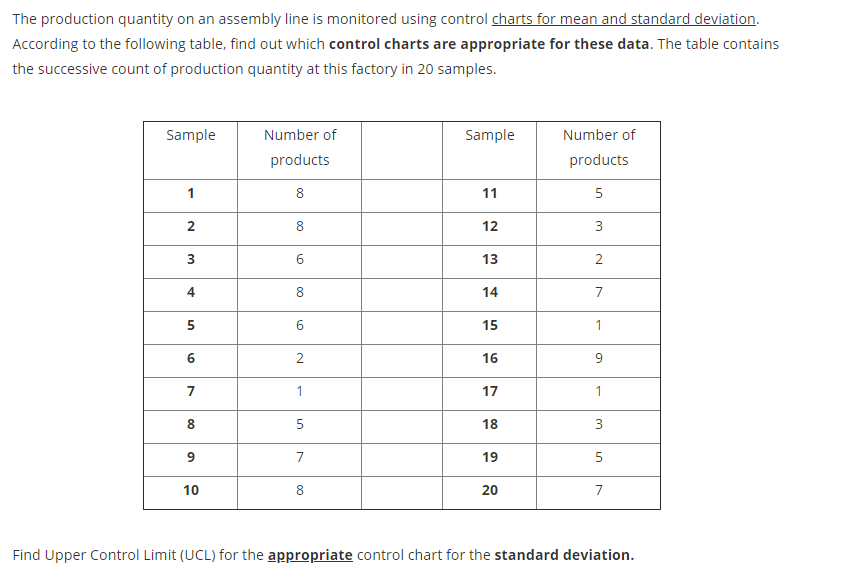
The production quantity on an assembly line is monitored using control charts for mean and standard deviation. According to the following table, find out which control charts are appropriate for these data. The table contains the successive count of production quantity at this factory in 20 samples.
The production quantity on an assembly line is monitored using control charts for mean and standard deviation. According to the following table, find out which control charts are appropriate for these data. The table contains the successive count of production quantity at this factory in 20 samples.

Glencoe Algebra 1, Student Edition, 9780079039897, 0079039898, 2018
18th Edition
ISBN:9780079039897
Author:Carter
Publisher:Carter
Chapter10: Statistics
Section10.4: Distributions Of Data
Problem 19PFA

Related questions
Topic Video
Question
Transcribed Image Text:The production quantity on an assembly line is monitored using control charts for mean and standard deviation.
According to the following table, find out which control charts are appropriate for these data. The table contains
the successive count of production quantity at this factory in 20 samples.
Sample
Number of
Sample
Number of
products
products
1
8
11
5
2
8
12
3
3
13
4
8.
14
7
15
1
16
9.
7
1
17
1
8.
5
18
9
7
19
5
10
8.
20
7
Find Upper Control Limit (UCL) for the appropriate control chart for the standard deviation.
2.
6.
6.
2.
00
Expert Solution
This question has been solved!
Explore an expertly crafted, step-by-step solution for a thorough understanding of key concepts.

Step by step
Solved in 2 steps with 2 images

Knowledge Booster


Learn more about
Need a deep-dive on the concept behind this application? Look no further. Learn more about this topic, statistics and related others by exploring similar questions and additional content below.Recommended textbooks for you
Glencoe Algebra 1, Student Edition, 9780079039897…
Algebra
ISBN:
9780079039897
Author:
Carter
Publisher:
McGraw Hill
Glencoe Algebra 1, Student Edition, 9780079039897…
Algebra
ISBN:
9780079039897
Author:
Carter
Publisher:
McGraw Hill