The quality-control manager at a compact fluorescent light bulb (CFL) factory needs to determine whether the mean life of a large shipment of CFLS is equal to 7,453 hours. The population standard deviation is 1,080 hours. A random sample of 81 light bulbs indicates a sample mean life of 7,153 hours. a. At the 0.05 level of significance, is there evidence that the mean life is different from 7,453 hours? b. Compute the p-value and interpret its meaning. c. Construct a 95% confidence interval estimate of the population mean life of the light bulbs. d. Compare the results of (a) and (c). What conclusions do you reach? b. What is the p-value? O(Round to three decimal places as needed.) Interpret the meaning of the p-value. Choose the correct answer below. O A. Fail to reject Hg. There is not sufficient evidence to prove that the mean life is different from 7,453 hours. O B. Fail to reject Hg. There is sufficient evidence to prove that the mean life is different from 7,453 hours. OC. Reject Ho: There is sufficient evidence to prove that the mean life is different from 7,453 hours. O D. Reject Ho. There is not sufficient evidence to prove that the mean life is different from 7,453 hours. c. Construct a 95% confidence interval estimate of the population mean life of the light bulbs. OSus (Round to one decimal place as needed.) d. Compare the results of (a) and (c). What conclusions do you reach? O A. The results of (a) and (c) are the same: there is sufficient evidence to prove that the mean life is different from 7,453 hours. O B. The results of (a) and (c) are not the same: there is sufficient evidence to prove that the mean life is different from 7,453 hours. O c. The results of (a) and (c) are the same: there is not sufficient evidence to prove that the mean life is different from 7,453 hours. O D. The results of (a) and tel are not the same: there is not sufficient avidence to prove that the mean life is different from 7 453 hours
The quality-control manager at a compact fluorescent light bulb (CFL) factory needs to determine whether the mean life of a large shipment of CFLS is equal to 7,453 hours. The population standard deviation is 1,080 hours. A random sample of 81 light bulbs indicates a sample mean life of 7,153 hours. a. At the 0.05 level of significance, is there evidence that the mean life is different from 7,453 hours? b. Compute the p-value and interpret its meaning. c. Construct a 95% confidence interval estimate of the population mean life of the light bulbs. d. Compare the results of (a) and (c). What conclusions do you reach? b. What is the p-value? O(Round to three decimal places as needed.) Interpret the meaning of the p-value. Choose the correct answer below. O A. Fail to reject Hg. There is not sufficient evidence to prove that the mean life is different from 7,453 hours. O B. Fail to reject Hg. There is sufficient evidence to prove that the mean life is different from 7,453 hours. OC. Reject Ho: There is sufficient evidence to prove that the mean life is different from 7,453 hours. O D. Reject Ho. There is not sufficient evidence to prove that the mean life is different from 7,453 hours. c. Construct a 95% confidence interval estimate of the population mean life of the light bulbs. OSus (Round to one decimal place as needed.) d. Compare the results of (a) and (c). What conclusions do you reach? O A. The results of (a) and (c) are the same: there is sufficient evidence to prove that the mean life is different from 7,453 hours. O B. The results of (a) and (c) are not the same: there is sufficient evidence to prove that the mean life is different from 7,453 hours. O c. The results of (a) and (c) are the same: there is not sufficient evidence to prove that the mean life is different from 7,453 hours. O D. The results of (a) and tel are not the same: there is not sufficient avidence to prove that the mean life is different from 7 453 hours

MATLAB: An Introduction with Applications
6th Edition
ISBN:9781119256830
Author:Amos Gilat
Publisher:Amos Gilat
Chapter1: Starting With Matlab
Section: Chapter Questions
Problem 1P

Related questions
Question
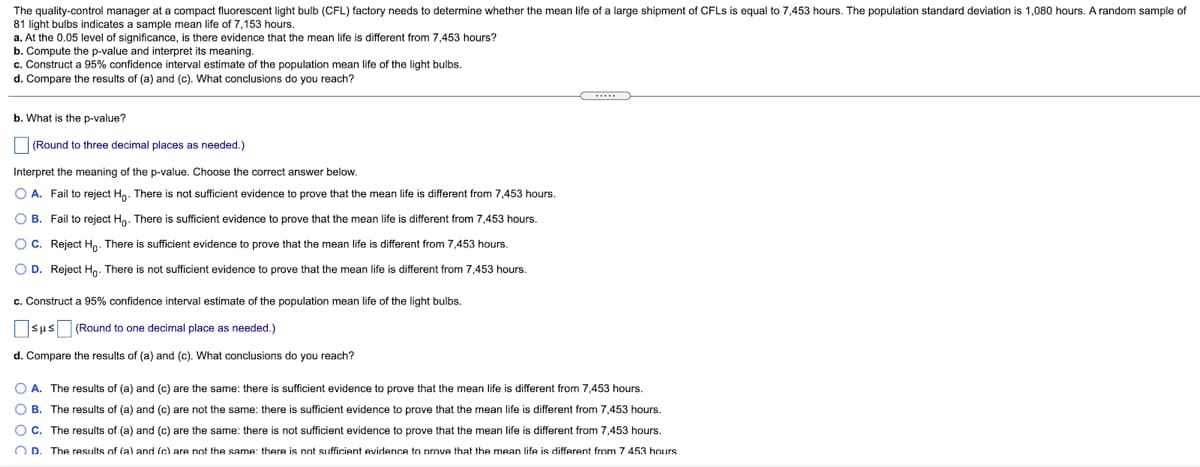
Transcribed Image Text:The quality-control manager at a compact fluorescent light bulb (CFL) factory needs to determine whether the mean life of a large shipment of CFLS is equal to 7,453 hours. The population standard deviation is 1,080 hours. A random sample of
81 light bulbs indicates a sample mean life of 7,153 hours.
a. At the 0.05 level of significance, is there evidence that the mean life is different from 7,453 hours?
b. Compute the p-value and interpret its meaning.
c. Construct a 95% confidence interval estimate of the population mean life of the light bulbs.
d. Compare the results of (a) and (c). What conclusions do you reach?
b. What is the p-value?
(Round to three decimal places as needed.)
Interpret the meaning of the p-value. Choose the correct answer below.
O A. Fail to reject Hn. There is not sufficient evidence to prove that the mean life is different from 7,453 hours.
O B. Fail to reject Ho. There is sufficient evidence to prove that the mean life is different from 7,453 hours.
Oc. Reject Ho. There is sufficient evidence to prove that the mean life is different from 7,453 hours.
O D. Reject Ho. There is not sufficient evidence to prove that the mean life is different from 7,453 hours.
c. Construct a 95% confidence interval estimate of the population mean life of the light bulbs.
Osus (Round to one decimal place as needed.)
d. Compare the results of (a) and (c). What conclusions do you reach?
O A. The results of (a) and (c) are the same: there is sufficient evidence to prove that the mean life is different from 7,453 hours.
O B. The results of (a) and (c) are not the same: there is sufficient evidence to prove that the mean life is different from 7,453 hours.
O C. The results of (a) and (c) are the same: there is not sufficient evidence to prove that the mean life is different from 7,453 hours.
OD.
The results of (a) and (c) are not the same: there is not sufficient evidence
nrove that the mean life is different from 7.453 hours
Expert Solution
This question has been solved!
Explore an expertly crafted, step-by-step solution for a thorough understanding of key concepts.

This is a popular solution!

Trending now
This is a popular solution!

Step by step
Solved in 2 steps with 2 images

Recommended textbooks for you
MATLAB: An Introduction with Applications
Statistics
ISBN:
9781119256830
Author:
Amos Gilat
Publisher:
John Wiley & Sons Inc

Probability and Statistics for Engineering and th…
Statistics
ISBN:
9781305251809
Author:
Jay L. Devore
Publisher:
Cengage Learning

Statistics for The Behavioral Sciences (MindTap C…
Statistics
ISBN:
9781305504912
Author:
Frederick J Gravetter, Larry B. Wallnau
Publisher:
Cengage Learning
MATLAB: An Introduction with Applications
Statistics
ISBN:
9781119256830
Author:
Amos Gilat
Publisher:
John Wiley & Sons Inc
Probability and Statistics for Engineering and th…
Statistics
ISBN:
9781305251809
Author:
Jay L. Devore
Publisher:
Cengage Learning
Statistics for The Behavioral Sciences (MindTap C…
Statistics
ISBN:
9781305504912
Author:
Frederick J Gravetter, Larry B. Wallnau
Publisher:
Cengage Learning

Elementary Statistics: Picturing the World (7th E…
Statistics
ISBN:
9780134683416
Author:
Ron Larson, Betsy Farber
Publisher:
PEARSON

The Basic Practice of Statistics
Statistics
ISBN:
9781319042578
Author:
David S. Moore, William I. Notz, Michael A. Fligner
Publisher:
W. H. Freeman

Introduction to the Practice of Statistics
Statistics
ISBN:
9781319013387
Author:
David S. Moore, George P. McCabe, Bruce A. Craig
Publisher:
W. H. Freeman