The random variable X is the crew size of a randomly selected shuttle mission. Its probability distribution is shown below. Complete parts a through c. x 2 4 5 6 7 8 P(X=x) 0.028 0.031 0.319 0.258 0.358 0.006 The mean is____.The one-standard-deviation interval is___,___the two-standard-deviation interval is___,___and the three-standard-deviation interval is____,____. (Type integers or decimals rounded to three decimal places as needed. Use ascending order.)
The random variable X is the crew size of a randomly selected shuttle mission. Its probability distribution is shown below. Complete parts a through c. x 2 4 5 6 7 8 P(X=x) 0.028 0.031 0.319 0.258 0.358 0.006 The mean is____.The one-standard-deviation interval is___,___the two-standard-deviation interval is___,___and the three-standard-deviation interval is____,____. (Type integers or decimals rounded to three decimal places as needed. Use ascending order.)

MATLAB: An Introduction with Applications
6th Edition
ISBN:9781119256830
Author:Amos Gilat
Publisher:Amos Gilat
Chapter1: Starting With Matlab
Section: Chapter Questions
Problem 1P

Related questions

Concept explainers
Contingency Table
A contingency table can be defined as the visual representation of the relationship between two or more categorical variables that can be evaluated and registered. It is a categorical version of the scatterplot, which is used to investigate the linear relationship between two variables. A contingency table is indeed a type of frequency distribution table that displays two variables at the same time.
Binomial Distribution
Binomial is an algebraic expression of the sum or the difference of two terms. Before knowing about binomial distribution, we must know about the binomial theorem.
Topic Video
Question
The random variable X is the crew size of a randomly selected shuttle mission. Its probability distribution is shown below. Complete parts a through c.
|
x
|
2
|
4
|
5
|
6
|
7
|
8
|
|
|---|---|---|---|---|---|---|---|
|
P(X=x)
|
0.028
|
0.031
|
0.319
|
0.258
|
0.358
|
0.006
|
|
The mean is____.The one-standard-deviation interval is___,___the two-standard-deviation interval is___,___and the three-standard-deviation interval is____,____.
(Type integers or decimals rounded to three decimal places as needed. Use ascending order.)
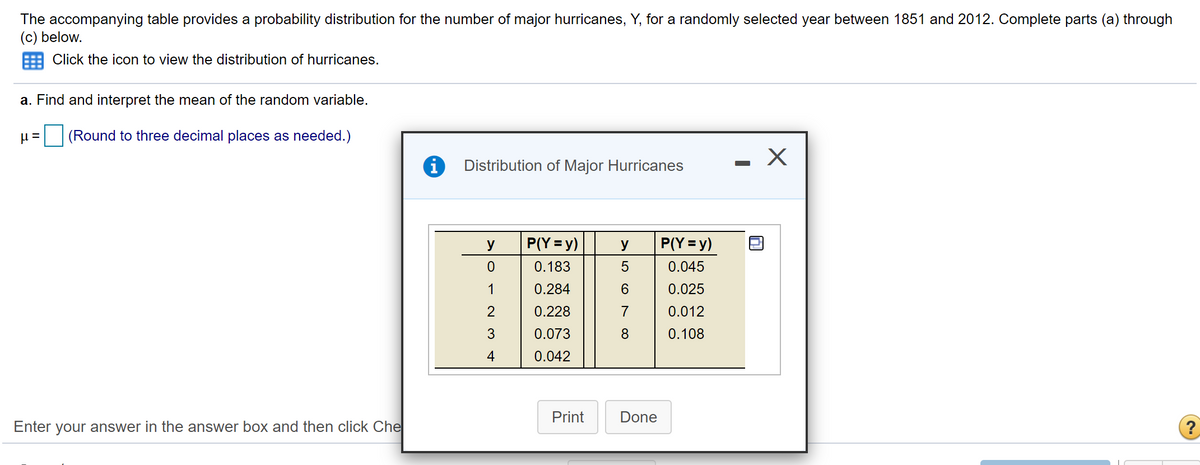
Transcribed Image Text:The accompanying table provides a probability distribution for the number of major hurricanes, Y, for a randomly selected year between 1851 and 2012. Complete parts (a) through
(c) below.
Click the icon to view the distribution of hurricanes.
a. Find and interpret the mean of the random variable.
(Round to three decimal places as needed.)
- X
Distribution of Major Hurricanes
y
P(Y = y)
y
P(Y = y)
0.183
0.045
1
0.284
0.025
2
0.228
7
0.012
3
0.073
0.108
4
0.042
Print
Done
Enter your answer in the answer box and then click Che
N CO
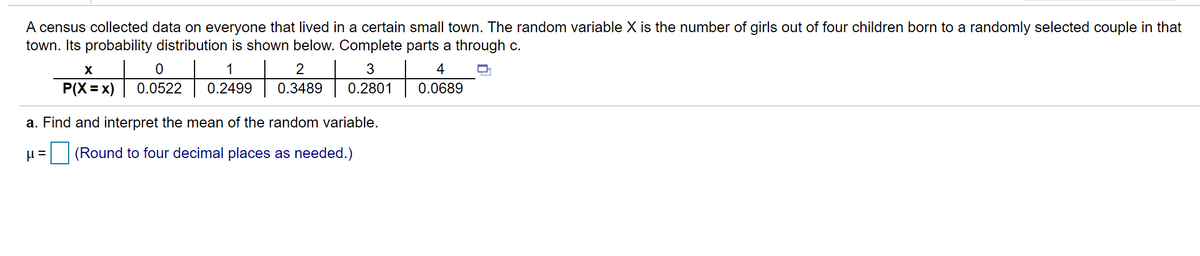
Transcribed Image Text:A census collected data on everyone that lived in a certain small town. The random variable X is the number of girls out of four children born to a randomly selected couple in that
town. Its probability distribution is shown below. Complete parts a through c.
sto
X
1
2
3
4
P(X = x)
0.0522
0.2499
0.3489
0.2801
0.0689
a. Find and interpret the mean of the random variable.
|(Round to four decimal places as needed.)
Expert Solution
This question has been solved!
Explore an expertly crafted, step-by-step solution for a thorough understanding of key concepts.

This is a popular solution!

Trending now
This is a popular solution!

Step by step
Solved in 2 steps with 2 images

Knowledge Booster


Learn more about
Need a deep-dive on the concept behind this application? Look no further. Learn more about this topic, statistics and related others by exploring similar questions and additional content below.Recommended textbooks for you
MATLAB: An Introduction with Applications
Statistics
ISBN:
9781119256830
Author:
Amos Gilat
Publisher:
John Wiley & Sons Inc

Probability and Statistics for Engineering and th…
Statistics
ISBN:
9781305251809
Author:
Jay L. Devore
Publisher:
Cengage Learning

Statistics for The Behavioral Sciences (MindTap C…
Statistics
ISBN:
9781305504912
Author:
Frederick J Gravetter, Larry B. Wallnau
Publisher:
Cengage Learning
MATLAB: An Introduction with Applications
Statistics
ISBN:
9781119256830
Author:
Amos Gilat
Publisher:
John Wiley & Sons Inc
Probability and Statistics for Engineering and th…
Statistics
ISBN:
9781305251809
Author:
Jay L. Devore
Publisher:
Cengage Learning
Statistics for The Behavioral Sciences (MindTap C…
Statistics
ISBN:
9781305504912
Author:
Frederick J Gravetter, Larry B. Wallnau
Publisher:
Cengage Learning

Elementary Statistics: Picturing the World (7th E…
Statistics
ISBN:
9780134683416
Author:
Ron Larson, Betsy Farber
Publisher:
PEARSON

The Basic Practice of Statistics
Statistics
ISBN:
9781319042578
Author:
David S. Moore, William I. Notz, Michael A. Fligner
Publisher:
W. H. Freeman

Introduction to the Practice of Statistics
Statistics
ISBN:
9781319013387
Author:
David S. Moore, George P. McCabe, Bruce A. Craig
Publisher:
W. H. Freeman