The random variable x represents the number of boys in a family of three children. Assuming that boys and girls are equally likely find the mean and standard deviation for the random variable x P(x) O 0.125 0.375 2. 0.375 3. 0.125 OA mean: 1.50, standard deviation: 0.76 OB. mean: 2.25, standard deviation: 0.76 Oc. mean 1.50, standard deviation: 0.87 OD. mean 2.25, standard deviation 087
The random variable x represents the number of boys in a family of three children. Assuming that boys and girls are equally likely find the mean and standard deviation for the random variable x P(x) O 0.125 0.375 2. 0.375 3. 0.125 OA mean: 1.50, standard deviation: 0.76 OB. mean: 2.25, standard deviation: 0.76 Oc. mean 1.50, standard deviation: 0.87 OD. mean 2.25, standard deviation 087

MATLAB: An Introduction with Applications
6th Edition
ISBN:9781119256830
Author:Amos Gilat
Publisher:Amos Gilat
Chapter1: Starting With Matlab
Section: Chapter Questions
Problem 1P

Related questions
Topic Video
Question
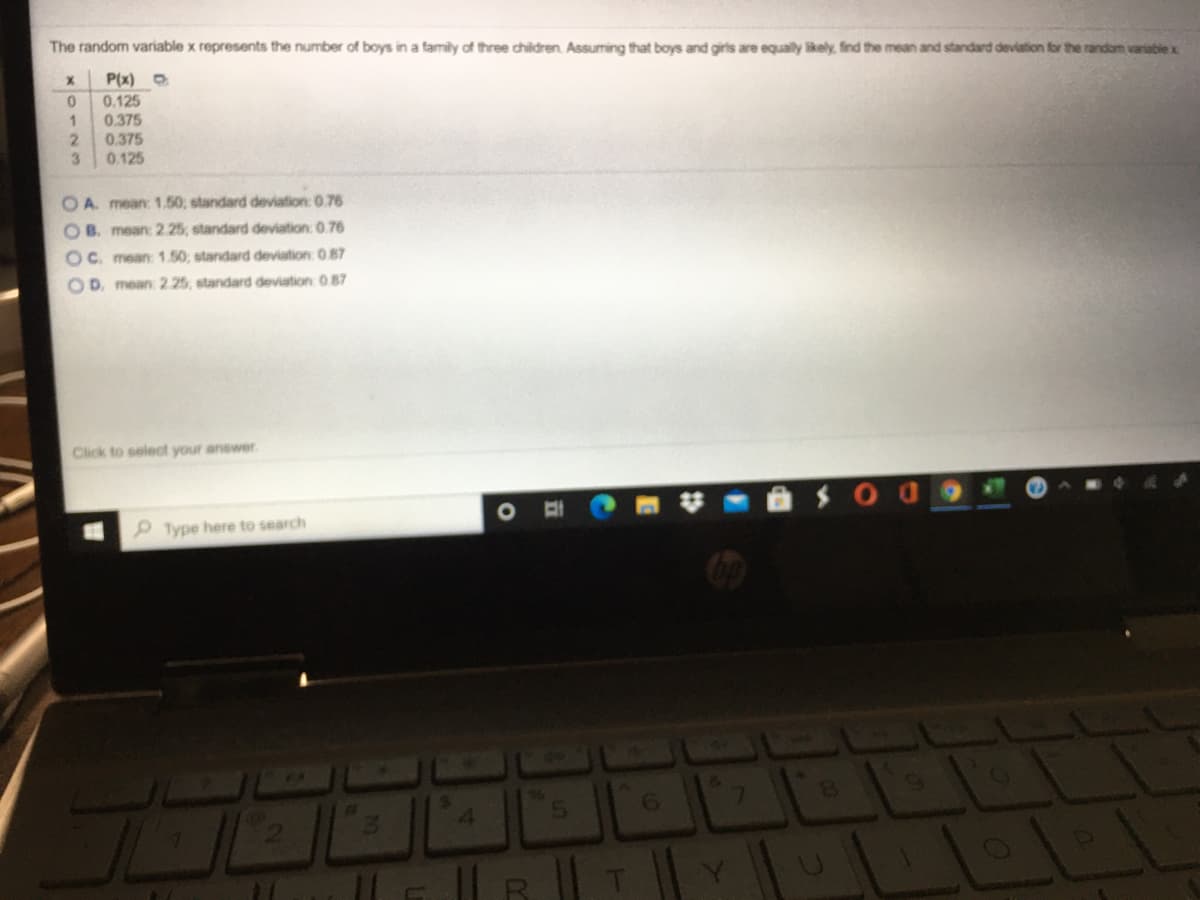
Transcribed Image Text:The random variable x represents the number of boys in a family of three children. Assuming that boys and girls are equally likely, find the mean and standard deviation for the random variable x
P(x)
0.125
0.375
2.
0.375
0.125
3.
OA. mean: 1.50; standard deviation: 0.76
OB. mean: 2.25, standard deviation: 0.76
OC. mean: 1.50; standard deviation: 087
OD. mean 2.25, standard deviation 0 87
Click to select your anewer
Type here to search
4.
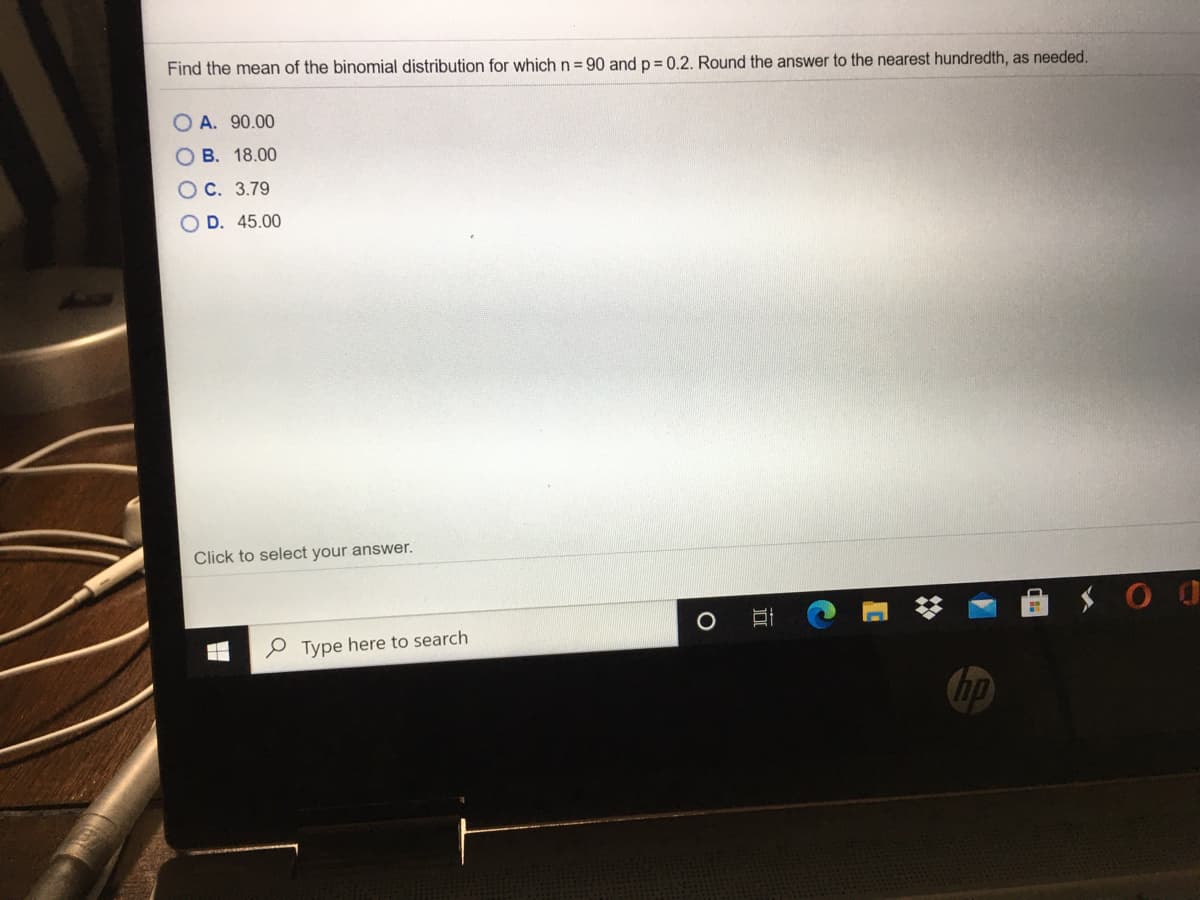
Transcribed Image Text:Find the mean of the binomial distribution for which n= 90 and p = 0.2. Round the answer to the nearest hundredth, as needed.
O A. 90.00
O B. 18.00
O C. 3.79
O D. 45.00
Click to select your answer.
O Type here to search
近
Expert Solution
Step 1
Note:
Hi there! Thank you for posting the questions. As there are several independent questions, according to our policy we have solved the first question. If you need help with other question, please re post separately.

Trending now
This is a popular solution!

Step by step
Solved in 2 steps with 2 images

Knowledge Booster


Learn more about
Need a deep-dive on the concept behind this application? Look no further. Learn more about this topic, statistics and related others by exploring similar questions and additional content below.Recommended textbooks for you
MATLAB: An Introduction with Applications
Statistics
ISBN:
9781119256830
Author:
Amos Gilat
Publisher:
John Wiley & Sons Inc

Probability and Statistics for Engineering and th…
Statistics
ISBN:
9781305251809
Author:
Jay L. Devore
Publisher:
Cengage Learning

Statistics for The Behavioral Sciences (MindTap C…
Statistics
ISBN:
9781305504912
Author:
Frederick J Gravetter, Larry B. Wallnau
Publisher:
Cengage Learning
MATLAB: An Introduction with Applications
Statistics
ISBN:
9781119256830
Author:
Amos Gilat
Publisher:
John Wiley & Sons Inc
Probability and Statistics for Engineering and th…
Statistics
ISBN:
9781305251809
Author:
Jay L. Devore
Publisher:
Cengage Learning
Statistics for The Behavioral Sciences (MindTap C…
Statistics
ISBN:
9781305504912
Author:
Frederick J Gravetter, Larry B. Wallnau
Publisher:
Cengage Learning

Elementary Statistics: Picturing the World (7th E…
Statistics
ISBN:
9780134683416
Author:
Ron Larson, Betsy Farber
Publisher:
PEARSON

The Basic Practice of Statistics
Statistics
ISBN:
9781319042578
Author:
David S. Moore, William I. Notz, Michael A. Fligner
Publisher:
W. H. Freeman

Introduction to the Practice of Statistics
Statistics
ISBN:
9781319013387
Author:
David S. Moore, George P. McCabe, Bruce A. Craig
Publisher:
W. H. Freeman