The rate of profit in the business sector of the United States from 1929 to 1962 is illustrated by the function Rin the graph below. Point A represents a rate of profit of 0.31 in the year 1929, or R(1929) = 0.31. Rate of Profit 0.5 E 0.4 F G D H I 0.3 C В 0.2 0.1 Year 1929 1932 1935 1938 1941 1944 1947 1950 1953 1956 1958 1962 What can be concluded about this function? Point D represents R(1941) = 0.37. Point B represents R(1932) = 0.2. O Point I represents R(1961) = 0.3. O Point E represents R(1945) = 0.5.
The rate of profit in the business sector of the United States from 1929 to 1962 is illustrated by the function Rin the graph below. Point A represents a rate of profit of 0.31 in the year 1929, or R(1929) = 0.31. Rate of Profit 0.5 E 0.4 F G D H I 0.3 C В 0.2 0.1 Year 1929 1932 1935 1938 1941 1944 1947 1950 1953 1956 1958 1962 What can be concluded about this function? Point D represents R(1941) = 0.37. Point B represents R(1932) = 0.2. O Point I represents R(1961) = 0.3. O Point E represents R(1945) = 0.5.

Algebra & Trigonometry with Analytic Geometry
13th Edition
ISBN:9781133382119
Author:Swokowski
Publisher:Swokowski
Chapter3: Functions And Graphs
Section3.4: Definition Of Function
Problem 87E

Related questions
Question
11
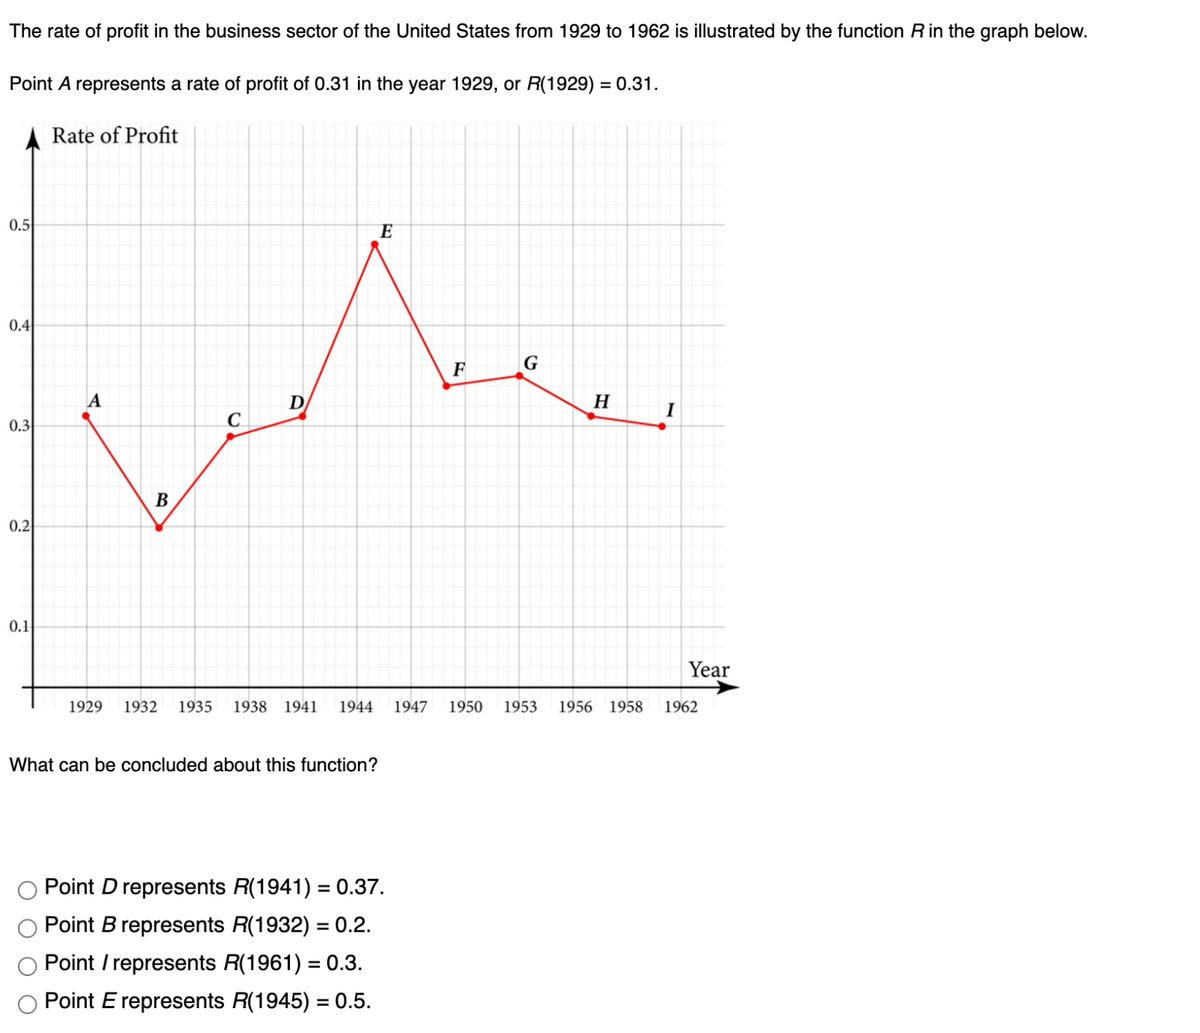
Transcribed Image Text:The rate of profit in the business sector of the United States from 1929 to 1962 is illustrated by the function R in the graph below.
Point A represents a rate of profit of 0.31 in the year 1929, or R(1929) = 0.31.
Rate of Profit
0.5
E
0.4
F
G
A
D
H
I
0.3
C
В
0.2
0.1
Year
1929
1932
1935
1938
1941
1944
1947
1950
1953
1956
1958
1962
What can be concluded about this function?
Point D represents R(1941) = 0.37.
Point B represents R(1932) = 0.2.
Point / represents R(1961) = 0.3.
O Point E represents R(1945) = 0.5.
%3D
%3D
Expert Solution
This question has been solved!
Explore an expertly crafted, step-by-step solution for a thorough understanding of key concepts.

This is a popular solution!

Trending now
This is a popular solution!

Step by step
Solved in 2 steps

Recommended textbooks for you
Algebra & Trigonometry with Analytic Geometry
Algebra
ISBN:
9781133382119
Author:
Swokowski
Publisher:
Cengage


Functions and Change: A Modeling Approach to Coll…
Algebra
ISBN:
9781337111348
Author:
Bruce Crauder, Benny Evans, Alan Noell
Publisher:
Cengage Learning
Algebra & Trigonometry with Analytic Geometry
Algebra
ISBN:
9781133382119
Author:
Swokowski
Publisher:
Cengage
Functions and Change: A Modeling Approach to Coll…
Algebra
ISBN:
9781337111348
Author:
Bruce Crauder, Benny Evans, Alan Noell
Publisher:
Cengage Learning