The reading speed of second grade students in a large city is approximately normal, with a mean of 88 words per minute (wpm) and a standard deviation of 10 wpm. Complete parts (a) through (f). Click here to view the standard normal distribution table (page 1). Click here to view the standard normal distribution table (page 2), (b) What is the probability that a random sample of 13 second grade students from the city results in a mean reading rate of more than 92 words per minute? The probability is 0.0746. (Round to four decimal places as needed.) Interpret this probability. Select the correct choice below and fill in the answer box within your choice. A. If 100 different samples of n = 13 students were chosen from this population, we would expect sample(s) to have a sample mean reading rate of less than 92 words per minute. B. If 100 different samples of n = 13 students were chosen from this population, we would expect 7 sample(s) to have a sample mean reading rate of more than 92 words per minute. C. If 100 different samples of n = 13 students were chosen from this population, we would expect sample(s) to have a sample mean reading rate of exactly 92 words per minute. (c) What is the probability that a random sample of 26 second grade students from the city results in a mean reading rate of more than 92 words per minute? The probability is (Round to four decimal places as needed.)
The reading speed of second grade students in a large city is approximately normal, with a mean of 88 words per minute (wpm) and a standard deviation of 10 wpm. Complete parts (a) through (f). Click here to view the standard normal distribution table (page 1). Click here to view the standard normal distribution table (page 2), (b) What is the probability that a random sample of 13 second grade students from the city results in a mean reading rate of more than 92 words per minute? The probability is 0.0746. (Round to four decimal places as needed.) Interpret this probability. Select the correct choice below and fill in the answer box within your choice. A. If 100 different samples of n = 13 students were chosen from this population, we would expect sample(s) to have a sample mean reading rate of less than 92 words per minute. B. If 100 different samples of n = 13 students were chosen from this population, we would expect 7 sample(s) to have a sample mean reading rate of more than 92 words per minute. C. If 100 different samples of n = 13 students were chosen from this population, we would expect sample(s) to have a sample mean reading rate of exactly 92 words per minute. (c) What is the probability that a random sample of 26 second grade students from the city results in a mean reading rate of more than 92 words per minute? The probability is (Round to four decimal places as needed.)

MATLAB: An Introduction with Applications
6th Edition
ISBN:9781119256830
Author:Amos Gilat
Publisher:Amos Gilat
Chapter1: Starting With Matlab
Section: Chapter Questions
Problem 1P

Related questions
Question
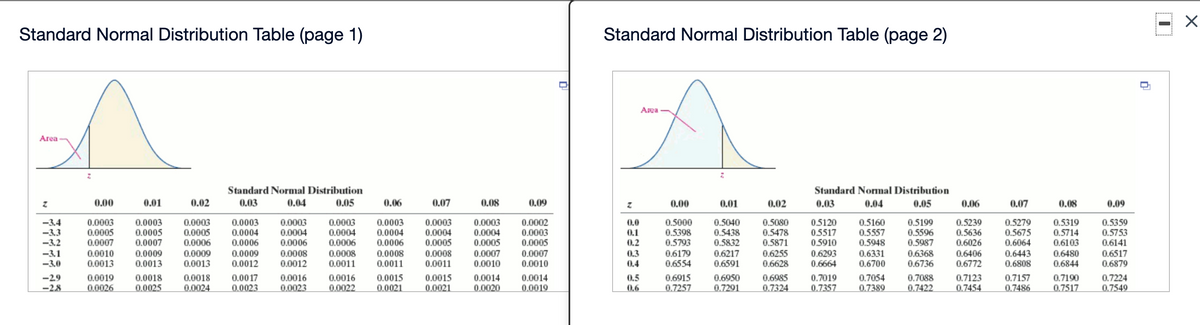
Transcribed Image Text:Standard Normal Distribution Table (page 1)
Standard Normal Distribution Table (page 2)
Area
Area
Standard Normal Distribution
Standard Normal Distribution
0.00
0.01
0.02
0.03
0.04
0.05
0.06
0.07
0.08
0.09
0.00
0.01
0.02
0.03
0.04
0.05
0.06
0.07
0.08
0.09
0.0003
0.0005
0.0007
0.0003
0.0005
0.0007
0.0003
0.0005
0.0006
0.0003
0.0004
0.0006
0.0003
0.0004
0.0006
0.0003
0.0004
0.0006
0.0003
0.0004
0.0006
0.0003
0.0004
0.0005
0.0003
0.0004
0.0005
0.0007
0.0010
0.0002
0.0003
0.0005
0.0007
0.0010
0.5040
0.5438
0.5832
0.6217
0.6591
0.5080
0.5478
0.5871
0.6255
0.6628
0.5120
0.5517
0.5910
0.6293
0.6664
0.5199
0.5596
0.5987
0.6368
0.6736
0.5279
0.5675
0.6064
0.6443
0.6808
0.5319
0.5714
0.6103
0.5160
0.5557
0.5239
0.5636
0.6026
0.5359
0.5753
0.6141
-3.4
0.5000
0.5398
0.5793
0.0
-3.3
-3.2
0.1
0,2
0.5948
-3.1
-3.0
0.0010
0.0013
0.0009
0.0013
0.0009
0.0013
0.0009
0.0012
0.0008
0.0012
0.0008
0.0011
0.3
0.4
0.6179
0.6554
0.6480
0.6844
0.6517
0.6879
0.0008
0.0008
0.0011
0.6331
0.6406
0.6772
0.0011
0.6700
0.0019
0.0026
0.0014
0.0020
0.6985
0.7324
0.7123
0.7454
0.7157
0.7486
0.7190
0.7517
0.0015
0.0014
0.0019
0.6915
0.7257
0.6950
0.7054
0.7389
-29
0.0018
0.0018
0.0017
0.0016
0.0023
0.0016
0.0022
0.0015
0.5
0.6
0.7019
0.7088
0.7224
-28
0.0025
0.0024
0.0023
0.0021
0.0021
0.7291
0.7357
0.7422
0.7549
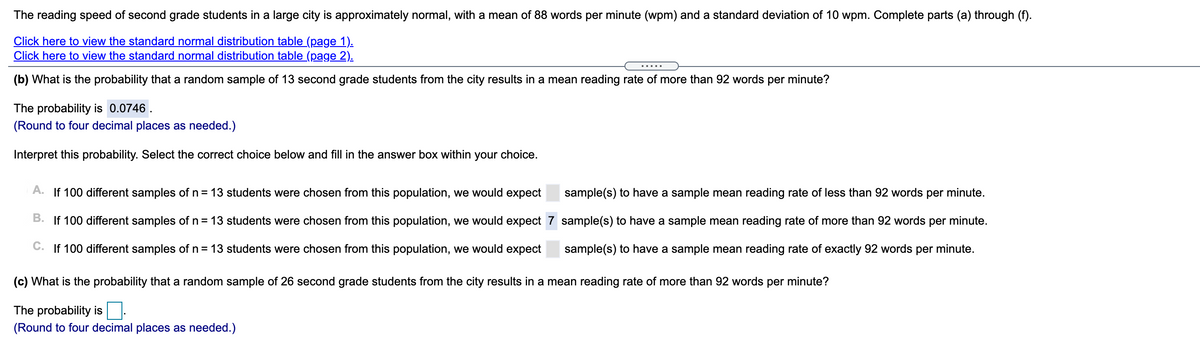
Transcribed Image Text:The reading speed of second grade students in a large city is approximately normal, with a mean of 88 words per minute (wpm) and a standard deviation of 10 wpm. Complete parts (a) through (f).
Click here to view the standard normal distribution table (page 1).
Click here to view the standard normal distribution table (page 2).
(b) What is the probability that a random sample of 13 second grade students from the city results in a mean reading rate of more than 92 words per minute?
The probability is 0.0746 .
(Round to four decimal places as needed.)
Interpret this probability. Select the correct choice below and fill in the answer box within your choice.
A. If 100 different samples of n = 13 students were chosen from this population, we would expect
sample(s) to have a sample mean reading rate of less than 92 words per minute.
B. If 100 different samples of n = 13 students were chosen from this population, we would expect 7 sample(s) to have a sample mean reading rate of more than 92 words per minute.
C. If 100 different samples of n = 13 students were chosen from this population, we would expect
sample(s) to have a sample mean reading rate of exactly 92 words per minute.
(c) What is the probability that a random sample of 26 second grade students from the city results in a mean reading rate of more than 92 words per minute?
The probability is
(Round to four decimal places as needed.)
Expert Solution
This question has been solved!
Explore an expertly crafted, step-by-step solution for a thorough understanding of key concepts.

This is a popular solution!

Trending now
This is a popular solution!

Step by step
Solved in 2 steps with 1 images

Recommended textbooks for you
MATLAB: An Introduction with Applications
Statistics
ISBN:
9781119256830
Author:
Amos Gilat
Publisher:
John Wiley & Sons Inc

Probability and Statistics for Engineering and th…
Statistics
ISBN:
9781305251809
Author:
Jay L. Devore
Publisher:
Cengage Learning

Statistics for The Behavioral Sciences (MindTap C…
Statistics
ISBN:
9781305504912
Author:
Frederick J Gravetter, Larry B. Wallnau
Publisher:
Cengage Learning
MATLAB: An Introduction with Applications
Statistics
ISBN:
9781119256830
Author:
Amos Gilat
Publisher:
John Wiley & Sons Inc
Probability and Statistics for Engineering and th…
Statistics
ISBN:
9781305251809
Author:
Jay L. Devore
Publisher:
Cengage Learning
Statistics for The Behavioral Sciences (MindTap C…
Statistics
ISBN:
9781305504912
Author:
Frederick J Gravetter, Larry B. Wallnau
Publisher:
Cengage Learning

Elementary Statistics: Picturing the World (7th E…
Statistics
ISBN:
9780134683416
Author:
Ron Larson, Betsy Farber
Publisher:
PEARSON

The Basic Practice of Statistics
Statistics
ISBN:
9781319042578
Author:
David S. Moore, William I. Notz, Michael A. Fligner
Publisher:
W. H. Freeman

Introduction to the Practice of Statistics
Statistics
ISBN:
9781319013387
Author:
David S. Moore, George P. McCabe, Bruce A. Craig
Publisher:
W. H. Freeman