The real income suddenly drops by one dollar. What is the expected effect on monthly consumption?
The real income suddenly drops by one dollar. What is the expected effect on monthly consumption?

Linear Algebra: A Modern Introduction
4th Edition
ISBN:9781285463247
Author:David Poole
Publisher:David Poole
Chapter4: Eigenvalues And Eigenvectors
Section4.6: Applications And The Perron-frobenius Theorem
Problem 25EQ

Related questions

Concept explainers
Contingency Table
A contingency table can be defined as the visual representation of the relationship between two or more categorical variables that can be evaluated and registered. It is a categorical version of the scatterplot, which is used to investigate the linear relationship between two variables. A contingency table is indeed a type of frequency distribution table that displays two variables at the same time.
Binomial Distribution
Binomial is an algebraic expression of the sum or the difference of two terms. Before knowing about binomial distribution, we must know about the binomial theorem.
Topic Video
Question
The real income suddenly drops by one dollar. What is the expected effect on monthly consumption?
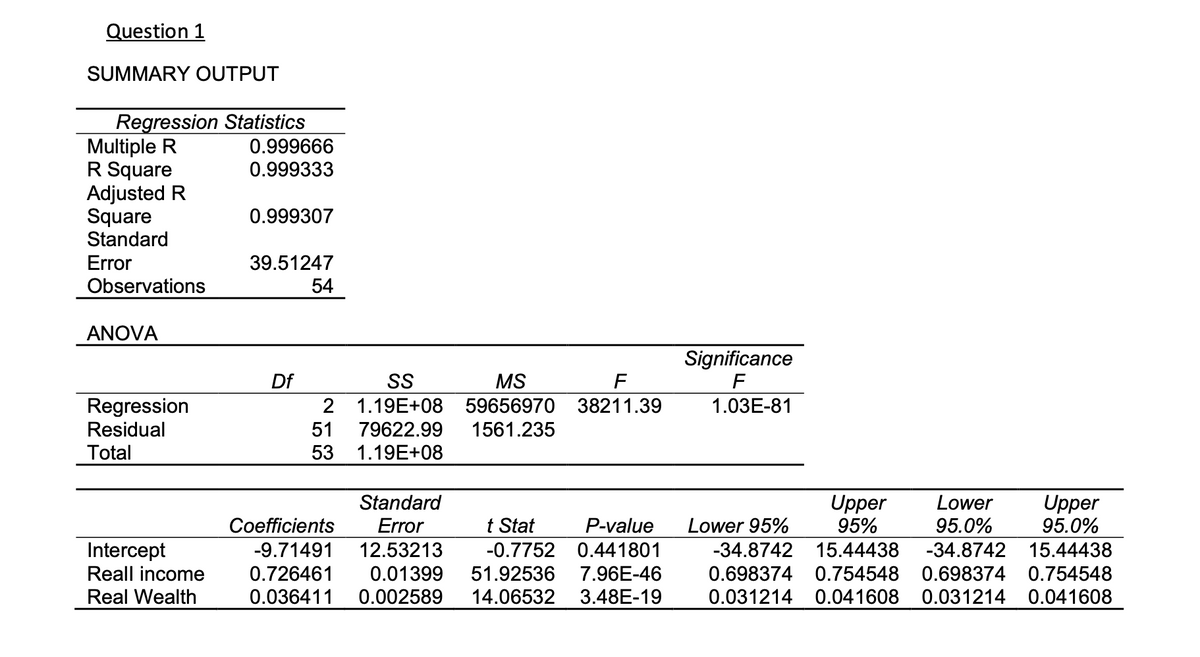
Transcribed Image Text:Question 1
SUMMARY OUTPUT
Regression Statistics
Multiple R
R Square
Adjusted R
Square
Standard
0.999666
0.999333
0.999307
Error
Observations
39.51247
54
ANOVA
Significance
F
Df
S
MS
F
Regression
Residual
2 1.19E+08 59656970 38211.39
1.03E-81
51
79622.99
1561.235
Total
53
1.19E+08
Standard
Upper
95%
Lower
95.0%
Upper
95.0%
Coefficients
Error
t Stat
P-value
Lower 95%
15.44438
Intercept
Reall income
Real Wealth
-9.71491
12.53213
-0.7752 0.441801
-34.8742 15.44438
-34.8742
0.726461
0.01399
51.92536
7.96E-46
0.698374 0.754548
0.698374 0.754548
0.036411
0.002589
14.06532
3.48E-19
0.031214 0.041608 0.031214 0.041608
Expert Solution
This question has been solved!
Explore an expertly crafted, step-by-step solution for a thorough understanding of key concepts.

Step by step
Solved in 2 steps with 1 images

Knowledge Booster


Learn more about
Need a deep-dive on the concept behind this application? Look no further. Learn more about this topic, statistics and related others by exploring similar questions and additional content below.Recommended textbooks for you
Linear Algebra: A Modern Introduction
Algebra
ISBN:
9781285463247
Author:
David Poole
Publisher:
Cengage Learning
Linear Algebra: A Modern Introduction
Algebra
ISBN:
9781285463247
Author:
David Poole
Publisher:
Cengage Learning