The regarding the USA population are also provided and will be used to determine the "Expected" frequenc and counts. You will have to analyze the data and provide phenotype, genotype and allele frequencies a well as perform a chi-square analysis. Complete every single empty square. For frequencies, (O-E)2/E am round to two decimal places. For counts use whole numbers. Test paper T = Phenyilthiocarbamide (PTC) TASTERS (p²+2pg) # Frequency NON-TASTERS (9²) Frequency # Hint: Find q first Allele frequency р q
The regarding the USA population are also provided and will be used to determine the "Expected" frequenc and counts. You will have to analyze the data and provide phenotype, genotype and allele frequencies a well as perform a chi-square analysis. Complete every single empty square. For frequencies, (O-E)2/E am round to two decimal places. For counts use whole numbers. Test paper T = Phenyilthiocarbamide (PTC) TASTERS (p²+2pg) # Frequency NON-TASTERS (9²) Frequency # Hint: Find q first Allele frequency р q

Glencoe Algebra 1, Student Edition, 9780079039897, 0079039898, 2018
18th Edition
ISBN:9780079039897
Author:Carter
Publisher:Carter
Chapter10: Statistics
Section10.3: Measures Of Spread
Problem 1GP

Related questions
Question
What numbers do I use to calculate x^2? (In other words, what #s do I use to plug in O-E^2/E?)
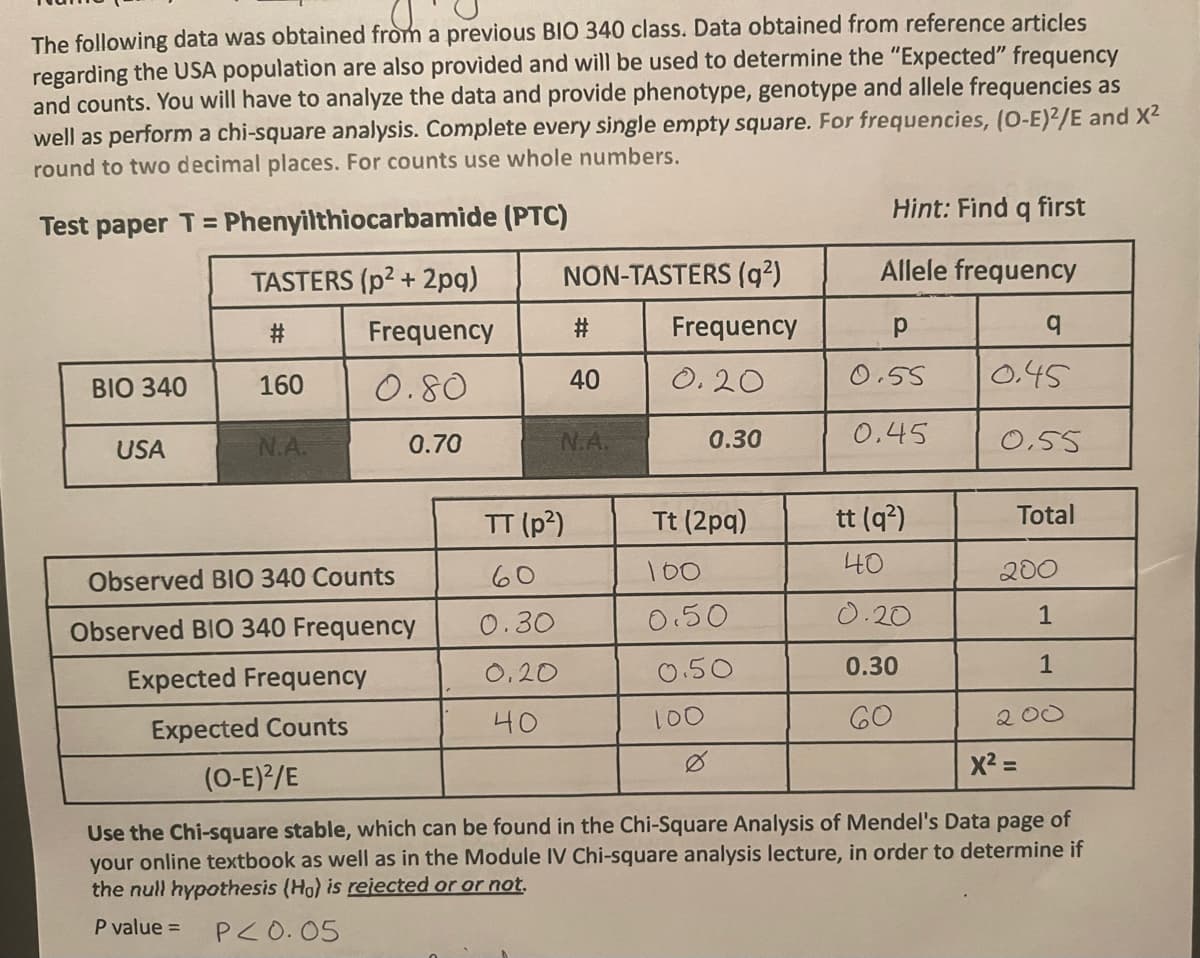
Transcribed Image Text:The following data was obtained from a previous BIO 340 class. Data obtained from reference articles
regarding the USA population are also provided and will be used to determine the "Expected" frequency
and counts. You will have to analyze the data and provide phenotype, genotype and allele frequencies as
well as perform a chi-square analysis. Complete every single empty square. For frequencies, (O-E)2/E and X²
round to two decimal places. For counts use whole numbers.
Test paper T = Phenyilthiocarbamide (PTC)
BIO 340
USA
TASTERS (p²+2pq)
#
Frequency
160
0.80
0.70
N.A.
Observed BIO 340 Counts
Observed BIO 340 Frequency
Expected Frequency
Expected Counts
NON-TASTERS (q²)
Frequency
0.20
#
40
N.A.
TT (p²)
60
0.30
0.20
40
0.30
Tt (2pq)
100
0.50
0.50
100
Hint: Find q first
Allele frequency
р
0.55
0.45
tt (q²)
40
0.20
0.30
60
q
0.45
0.55
Total
200
1
1
200
x² =
(O-E)²/E
Use the Chi-square stable, which can be found in the Chi-Square Analysis of Mendel's Data page of
your online textbook as well as in the Module IV Chi-square analysis lecture, in order to determine if
the null hypothesis (Ho) is rejected or or not.
P value=
P<0.05
Expert Solution
This question has been solved!
Explore an expertly crafted, step-by-step solution for a thorough understanding of key concepts.

Step by step
Solved in 3 steps with 1 images

Recommended textbooks for you
Glencoe Algebra 1, Student Edition, 9780079039897…
Algebra
ISBN:
9780079039897
Author:
Carter
Publisher:
McGraw Hill
Glencoe Algebra 1, Student Edition, 9780079039897…
Algebra
ISBN:
9780079039897
Author:
Carter
Publisher:
McGraw Hill