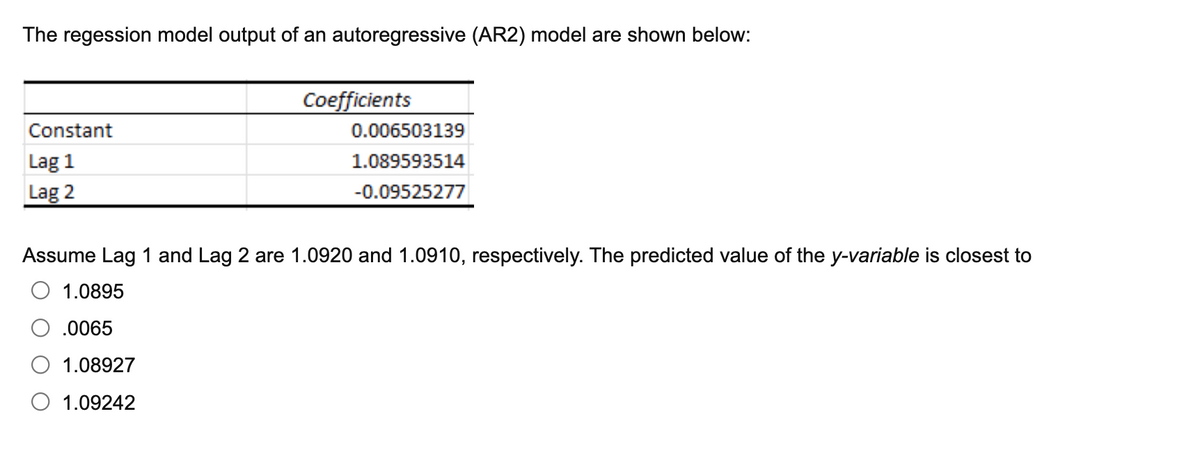
The regession model output of an autoregressive (AR2) model are shown below: Coefficients Constant 0.006503139 Lag 1 Lag 2 1.089593514 -0.09525277 Assume Lag 1 and Lag 2 are 1.0920 and 1.0910, respectively. The predicted value of the y-variable is closest to 1.0895 O .0065 O 1.08927 1.09242


Q: A report in LTO stated that the average age of taxis in the Philippines is 12 years. An operations…
A:
Q: 8. From the Stem and Leaf diagram below what will the median be? Stem Leaf 1 7 7 8 2 3 3 4 1 2 5 3 3…
A: from the given steam and leaf diagram 17,17,18,20,22,23,30,30,30,41,42,43,53,53,60,64,45
Q: will provide the required data in a seperate set Death Rate per 100,000 people and Donald Trump’s…
A: Since you have asked multiple questions, we will solve the first question for you. If you want any…
Q: A data set includes data from student evaluations of courses. The summary statistics are n = 89. *=…
A:
Q: What is the expected expense of the machine being used 34 hours per week?
A: Regression line are used to predict the variable. It is calculated by the combined value of…
Q: In sample surveys, what is meant by bias? O A systematic error in a sampling method that leads to an…
A:
Q: a. Is there a main effect of Drug Dose? Explain. b. Is there a main effect of Sex? Explain. c.…
A: a. Yes, because the mean food consumption of food is higher for the "NoDrug" group compared to the…
Q: Mark borrowed 65, 000 php from Rhenz under the following conditions: simple interest rate of 2.5%;…
A:
Q: 6. What are graph and diagrams? What are the importance and limitation of diagrammatic ar graphical…
A: Graphs are used to represent statistical data. It visulaizes how two or more variables that are…
Q: An empirical researcher reports the following for a particular stock: “In our data sample we find…
A:
Q: Given an exchange table for the economy that consists of three sectors. Distribution of Output from:…
A:
Q: 1. provide the process of establishing confidence interval step by step. 2. According to past…
A: SOLUTION; First we have to find a sample statistic. (eg. sample mean, sample proportion etc.) Then…
Q: A bond has 10 years remaining until maturity, a YIM of 5% and a duration of 6.5. (one-year) rate is…
A:
Q: Use the uniqueness of moment-generating functions to give the distribution and the mean of a random…
A:
Q: A random sample of 23 components is drawn from a population size of 100. The mean measurement of the…
A: Given that Sample size n =23 Sample mean =67.45 Standard deviation =2.93
Q: 5. Fit a cubic polynomial to the following data: 3 4 7 8 11 12 y 1.6 3.6 4.4 3.4 2.2 2.8 3.8 4.6…
A:
Q: ) Let X probability density function: {X1, X2,. . , Xn} be a random sample from the distribution…
A:
Q: statictic bionomial distribution
A: 9)Givensample size(n)=100p=0.005Let "x" be the no. of defectivex~Binomial(n=100 ,…
Q: A quality inspector measured the diameter of a ball bearing using a new type of caliper. The results…
A: “Since you have posted a question with multiple sub-parts, we will solve first three sub-parts for…
Q: (c) Find a pivotal function of the maximum likelihood estimator found in (b). (d) Use the pivotal…
A:
Q: Glaucoma is a leading cause of blindness in the United States, N. Ehlers measured the difference in…
A: According to the provided output, the hypothesized value is not known. so it must be considered as…
Q: question 5
A: The Specialty Toys Company faces a challenge of deciding what percentage units of a brand new toy…
Q: The mean annual income of workers who are college graduates greater than 120,000.00 a year
A: Given problem Given that The mean annual income of workers who are college graduates greater…
Q: 3. The data shown in the table represent the completion time (in minutes) of exams taken by two…
A: Claim : the average completion time of student 2 exceeds that of student 1 by more than 4 minutes.
Q: 2.4 Solve the below problem: The change in depth of a dam from one day to the next, measured (in…
A:
Q: what are the most effective methods for exploring and preparing data?
A: The effective ways of exploring and preparing the data are to be listed.
Q: If a random process, X(t)= A cos wt + Bsin wt is given, where A and B are uncorrelated, zero mean…
A:
Q: ch of the fOllowing scales would be best f O black, non-black O white, black, Hispanic, Asian, other…
A: Research as a scientific and systematic approach for pertinent information on a specific domain…
Q: 21. The life of a drill bit has a mean of 16 hours and a standard deviation of 2-6 hours. Assuming a…
A:
Q: It is claimed that the percentage of viewers tuned to a TV station's new sitcom is 30%. Out of the…
A:
Q: 1.1. Show that Y(n) max(Y1, Y2, ..., Yn) is sufficient for 0.
A:
Q: 1..The null hypothesis of Ho is? 2.The alternative hypothesis is? 3.The test to be used is-
A: Given that Sample size n =40 Sample mean =89 Standard deviation =10 NOTE:- According to bartleby…
Q: A tea store manager claims that Branch A has lower average daily sales compared to Branch B. He…
A: Disclaimer: “Since you have posted a question with multiple sub-parts, we will solve first three…
Q: Long-distance runners have contended that moderate exposure to ozone increases lung capacity. To…
A: Claim : the ozone exposure increases lung capacity.
Q: A data set includes data from student evaluations of courses. The summary statistics are n=99,…
A:
Q: Write the null hypothesis and alternative hypothesis in each of the following situations. (statement…
A: Given situation: A sociologist wants to find out if more Liberal voters than conservative voters…
Q: A survey of 1000 students concluded that 274 students chose a professional baseball team, A, as his…
A: The question is about a confidence int. for a difference between two popl. prop. Given : No. of…
Q: If you have an average age of 35 with a standard deviation of 37 years, what might you conclude…
A: Given that, Average age is 35 with a standard deviation of 37 years. The objective is to conclude…
Q: will provide the required data in a seperate set Death Rate per 100,000 people and Donald Trump’s…
A: Since you have posted a question with multiple sub-parts, we will solve first three sub-parts for…
Q: A letter is chosen at random from the word 'ASSASSINATION'. Find the probability that letter is (i)…
A:
Q: You are interested in average College Admission Test scores of the entering class would be the…
A: As we know that population is the whole group that we want to draw conclusions about it. And, sample…
Q: a. Give the null and alternative hypotheses for testing whether the true proportion of alligators…
A: The question is based on a hypo. testing of a popl. prop. Given : Assumed prop. of movement toward…
Q: "An electrical firm produces light bulbs that have a length of life that is approximately normally…
A:
Q: d) Using α=.05, what is tcrit? e) Given pooled variance = 8.99, Calculate tobt. f) What should…
A: Given: No treatment Visualization treatment 22 19 18 17 27 24 20 21 23 27 26 21 22…
Q: Question 1 1.1 In your own words, use an example to explain what a random variable is. 1.2 Does…
A: “Since you have posted a question with multiple sub-parts, we will solve first three sub-parts for…
Q: Do people feel hungrier after sampling a healthy snack? Researchers randomly assign volunteers into…
A: Using SPSS: Type data in to SPSS: To run a One-Way ANOVA in SPSS, click Analyze > Compare Means…
Q: A tea store manager claims that Branch A has lower average daily sales compared to Branch B. He…
A: According to our policy we can answer only first three question for remaining please repost the…
Q: During the Lazhopee 11-11 event, it was observed that male users were shopping most often for mo…
A: The random sample of 500 users were obtained and their sex and the category of the item bought was…
Q: 3. Which of the following is not a measure of central tendency? a) Median b) Mode c) Mean d)…
A:
Q: 3.1. Use the Neyman-Person lemma to find the best critical region of size 0.034 for testing Ho:0 = 1…
A:


Trending now
This is a popular solution!

Step by step
Solved in 3 steps

- The table shows a part of an output of a linear regression model predicting the average fare on different flight routes. Data Table Regression Table Coefficient Constant 95.80976147 COUPON −9.61654124 DISTANCE 0.080733811 PAX −0.000167343 What is the difference in prediction of the following two routes? Route A that is 3,000 miles, with COUPON=1.5 and PAX=6,000 Route B that is 3,000 miles, with COUPON=1.2 and PAX=6,000.Consider the least square estimate and the ridge regression estimate of the linear regression coefficients, which of the following(s) is (are) always correct? and why? A. Least square has a smaller training error. B. Ridge regression has a smaller training error. C. Least square has a smaller test error. D. Ridge regression has a smaller test error.A student used multiple regression analysis to study how family spending (y) is influenced by income(x1), family size (x2), and additionsto savings(x3). The variables y, x1, and x3 are measured in thousandsof dollars. The following results were obtained.ANOVAdf SSRegression 3 45.9634Residual 11 2.6218TotalCoefficients Standard ErrorIntercept 0.0136x10.7992 0.074x20.2280 0.190x3-0.5796 0.920 Carry out a test to see if x3 and y are significantly related. Use a 5% level of significance.
- A student used multiple regression analysis to study how family spending (y) is influenced by income(x1), family size (x2), and additionsto savings(x3). The variables y, x1, and x3 are measured in thousandsof dollars. The following results were obtained.ANOVAdf SSRegression 3 45.9634Residual 11 2.6218TotalCoefficients Standard ErrorIntercept 0.0136x10.7992 0.074x20.2280 0.190x3-0.5796 0.920 Carry out a test to determine whether y is significantly related to the independent variables.Use a 5% level of significance.Consider an estimated linear regression model with a response Y and 4 predictors X1, X2, X3, X4. For a random sample of 25 observations on the response and the 4 predictors, the following estimates are obtained using Excel. Regression Statistics Multiple R 0.859825564 Standard Error 127.606 What is the adjusted R-square of the fitted model?A student used multiple regression analysis to study how family spending (y) is influenced by income(x1), family size (x2), and addition to savings(x3). The variables y, x1, and x3 are measured in thousandsof dollars. The following results were obtained.ANOVAdf SSRegression 3 45.9634Residual 11 2.6218TotalCoefficients Standard ErrorIntercept 0.0136x10.7992 0.074x20.2280 0.190x3-0.5796 0.920a. Write out the estimated regression equation for the relationship between the variables. b. Compute the coefficient of determination. What can you say about the strength of thisrelationship? c. Carry out a test to determine whether y is significantly related to the independent variables.Use a 5% level of significance. d. Carry out a test to see if x3 and y are significantly related. Use a 5% level of significance.
- The regression equation is ***** Predictor Coef StDev t-ratio p-value Constant 1.7586 0.2525 6.9648 0.0000 AGE 0.2124 0.3175 * 0.5042 MIL -0.7527 0.3586 -2.0991 ** ENG 4.8124 0.6196 7.7664 Analysis of Variance 0.0000 Source DF SS MS F p Regression 3 413.1291 138.7097 *** 0.00 Error 50 457.7607 2.2888 Total 53 a) What is dependent and independent variables? b) Fully write out the regression equationThe regression equation is ***** Predictor Coef StDev t-ratio p-value Constant 1.7586 0.2525 6.9648 0.0000 AGE 0.2124 0.3175 * 0.5042 MIL -0.7527 0.3586 -2.0991 ** ENG 4.8124 0.6196 7.7664 Analysis of Variance 0.0000 Source DF SS MS F p Regression 3 413.1291 138.7097 *** 0.00 Error 50 457.7607 2.2888 Total 53 c) Fill in the missing values ‘*’, ‘**’, and ‘***’. d) Hence test whether ? is significant. Give reasons for your answer.The regression equation is ***** Predictor Coef StDev t-ratio p-value Constant 1.7586 0.2525 6.9648 0.0000 AGE 0.2124 0.3175 * 0.5042 MIL -0.7527 0.3586 -2.0991 ** ENG 4.8124 0.6196 7.7664 Analysis of Variance 0.0000 Source DF SS MS F p Regression 3 413.1291 138.7097 *** 0.00 Error 50 457.7607 2.2888 Total 53 e) Perform the F Test making sure to state the null and alternative hypothesis. f) Given an interpretation of the term “R-sq” and comment on its value.
- Suppose that a multiple linear regression model was fit to data and that the following output resulted: Coefficients: (Intercept)exam1exam2attendance Estimate20.001.3002.5000.685 Std. Error4.2910.2610.2745.608 t value-4.6604.9819.124 0.122 Pr(>|t|)<0.0001<0.0001<0.00010.9032 Perform a backwards selection process. Select the variable that would be removed first from the model. The significance level is 0.05 for testing purposes. attendance exam2 exam1A. Identify the regression analyses necessary for testing this initial model. B. What are the direct and indirect effects of z2 on z5?For the regression model Yi = b0 + eI, derive the least squares estimator.