will provide the required data in a seperate set Death Rate per 100,000 people and Donald Trump’s share of the popular vote. A group of political activists noticed that hesitancy to get the vaccine for COVID-19 seems particularly strong in states that Donald Trump won in the 2020 presidential election. They wondered whether there is a correlation between the COVID-19 death rate per 100,000 people per state and Donald Trump’s share of the popular vote in 2020 per the 50 states and District of Columbia. The death rate data was sorted from a Johns Hopkins University/CNN report. The Voting data was sourced from CNN. Question 1: A Priori Statistical Power Before collecting the data, they decided to calculate a priori statistical power to determine how large a sample is needed to achieve 80% statistical power. G*Power Conduct an a priori power analysis using G*Power. (If you are not using a Windows or Macintosh computer use Statistics Kingdom to estimate sample size) Here are the setting for G*Power: Test family: t tests Statistical test: Correlation: Point biserial model Type of power analysis: A priori: Compute required sample size…. Tails: Two Effect size |ρ|: 0.40 α err prob: 0.05 Power (1-β prob): 0.8 a. What is the required sample size? b. What level of statistical power will be achieved? Round off your answer to four digits passed the decimal point. Using data from 50 states and the District of Columbia, do they have a sufficiently large sample size to achieve 80% power assuming that the coefficient of correlation is the population equal 0.40? Please an “X” in the appropriate box: Yes No Statistics Kingdom If you are using a Chromebook, conduct an a priori power analysis using the tool found at https://www.statskingdom.com/sample_size_regression.html. Here are the settings: Type: Regression Power: 0.8 Effect: Medium Effect Size: 0.1615 Significance level (α): 0.05 Predictors (p): 1 Effect Type: R2/η2 Digits: 4 What is the required sample size to achieve 80 percent statistical power? What level of statistical power will be achieved? Round off your answer to four digits passed the decimal point. Using data from 50 states and the District of Columbia, do they have a sufficiently large sample size to achieve 80% power assuming that the coefficient of correlation is the population equal 0.40? Please an “X” in the appropriate box: Yes No Question 2: You have two variables: 1) Death rate by state and 2) Percent of popular vote won by Donald Trump by state. Which is the independent variable and which is the dependent variable? Enter your answer in the table below: Variable Independent or Dependent? Death Rate by State Popular Vote Won By Trump explain your answer Question 3: Using Microsoft Excel: (Excel file Assignment10.xlsx) Calculate the mean and sample standard deviation of both the independent and dependent variables. Calculate the correlation coefficient, r, using Excel’s CORREL function. Explain what it means. Calculate the coefficient of determination, r2, using Excel’s RSQ function. Explain what it means. a very high score. Report your results here: Paste your Excel table here using Word’s Paste Special function. Coefficient of correlation means: Interpret the coefficient of correlation using this table. Negative Positive Meaning 0.00 to -0.099 0.00 to -.099 No Correlation -0.10 to -0.299 0.10 to 0.299 Small Correlation -0.30 to -0.499 0.30 to 0.499 Medium Correlation -0.50 to -1.000 0.50 to 1.000 Large Correlation Coefficient of determination means: Question 4: Using Excel, conduct a NHST to determine whether there is a correlation in the population. Use a 0.05 significance level. Use the Excel file: Assignment8_Spring22.xlsx Test Set-Up: What type of Null Hypothesis Test should you use? Is this a left-tailed, two-tailed, or right-tailed test? Place an “X” in the appropriate box: Left-Tail Two-Tail Right-Tail This is a t-test to determine whether there is a correlation in the population. Here is the formula for the Test Statistic: What is/are the critical value(s) for t? Degrees of freedom equals n – 2. Use a 5% significance level. How many critical values are there? Place an “X” in the appropriate box: One Two What is (are) the critical value(s)? Round off your answer to three digits passed the decimal point. Enter the value or values in this box: Write the Null & Alternate Hypotheses (Follow the examples shown in Clear-Sighted Statistics. Use the appropriate Greek letters and mathematical symbols). H0: H1: Here are the Greek Letters and mathematical symbols. Copy and paste the correct symbols. Mathematical Symbols = ≤ ≥ ≠ > < Greek Letters μ π σ ρ Σ ν Model your answer on the examples shown in Clear-Sighted Statistics. Write the Decision Rule using the Critical Value(s), not p-values. Model your answer on the examples shown in Clear-Sighted Statistics. Failure to do so will result in a major reduction of your grade. Critical Value(s): Decision Rule:


I will provide the required data in a seperate set
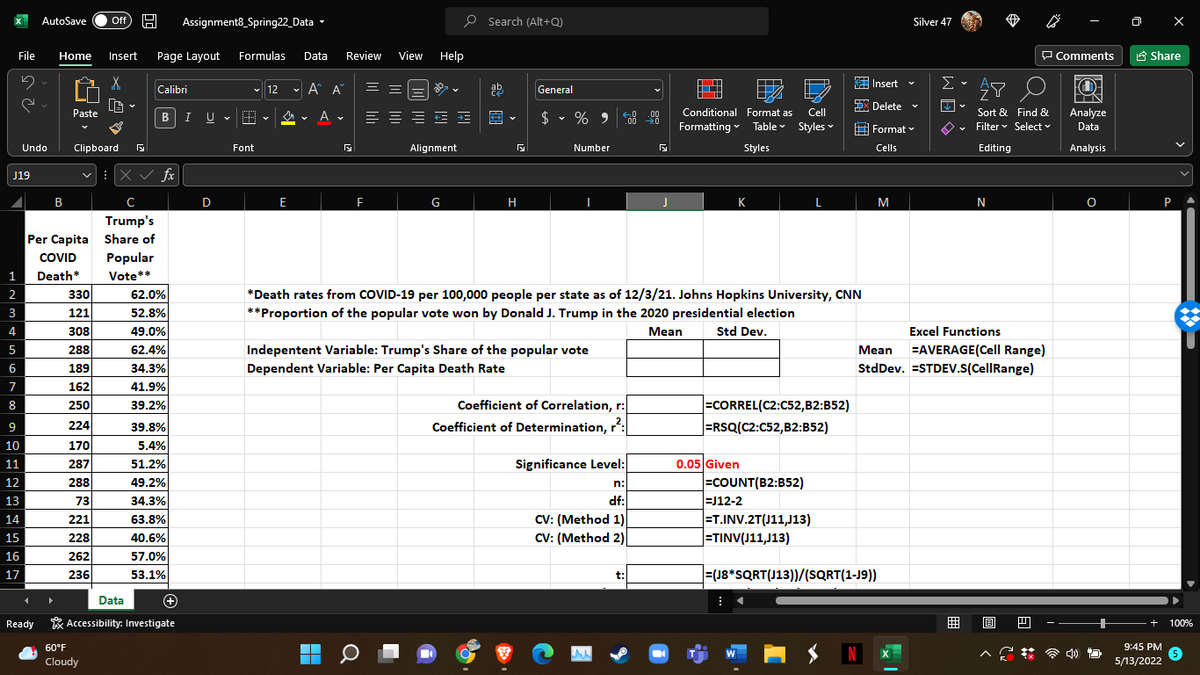
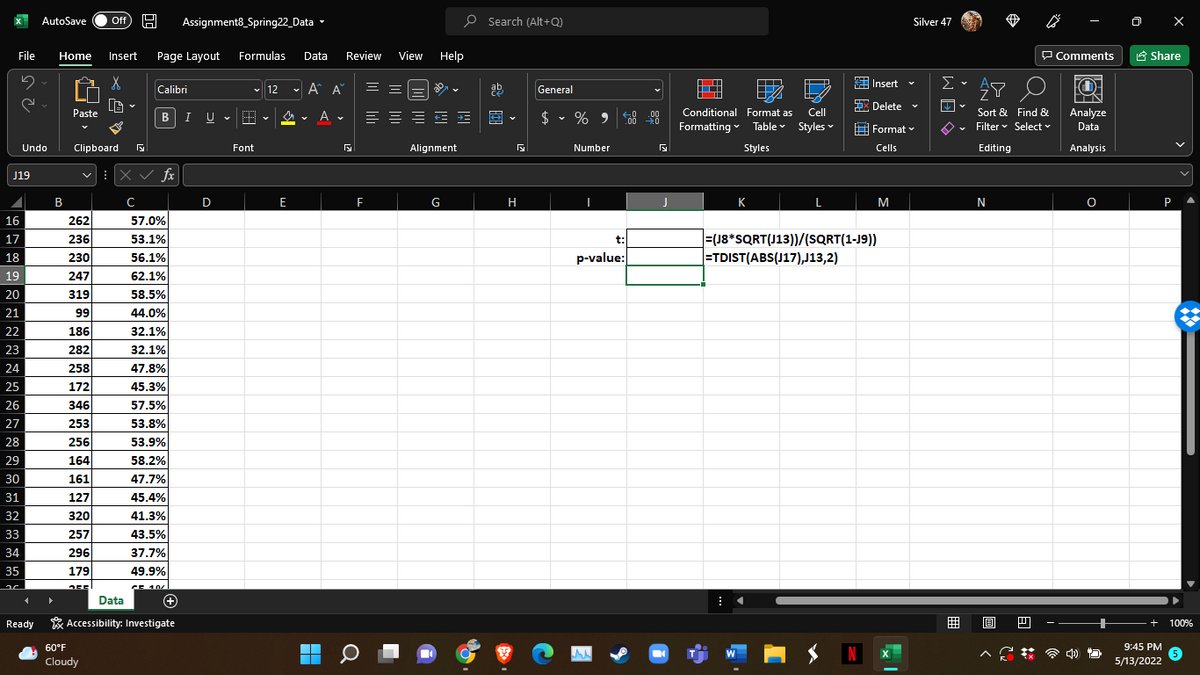
Death Rate per 100,000 people and Donald Trump’s share of the popular vote.
A group of political activists noticed that hesitancy to get the vaccine for COVID-19 seems particularly strong in states that Donald Trump won in the 2020 presidential election. They wondered whether there is a
Question 1: A Priori Statistical Power
Before collecting the data, they decided to calculate a priori statistical power to determine how large a sample is needed to achieve 80% statistical power.
G*Power
Conduct an a priori power analysis using G*Power. (If you are not using a Windows or Macintosh computer use Statistics Kingdom to estimate
Test family: t tests
Statistical test: Correlation: Point biserial model
Type of power analysis: A priori: Compute required sample size….
Tails: Two
Effect size |ρ|: 0.40
α err prob: 0.05
Power (1-β prob): 0.8
a. What is the required sample size?
b. What level of statistical power will be achieved? Round off your answer to four digits passed the decimal point.
Using data from 50 states and the District of Columbia, do they have a sufficiently large sample size to achieve 80% power assuming that the coefficient of correlation is the population equal 0.40? Please an “X” in the appropriate box:
|
Yes |
No |
|
|
|
Statistics Kingdom
If you are using a Chromebook, conduct an a priori power analysis using the tool found at https://www.statskingdom.com/sample_size_regression.html.
Here are the settings:
Type: Regression
Power: 0.8
Effect: Medium
Effect Size: 0.1615
Significance level (α): 0.05
Predictors (p): 1
Effect Type: R2/η2
Digits: 4
What is the required sample size to achieve 80 percent statistical power?
|
|
- What level of statistical power will be achieved? Round off your answer to four digits passed the decimal point.
|
|
Using data from 50 states and the District of Columbia, do they have a sufficiently large sample size to achieve 80% power assuming that the coefficient of correlation is the population equal 0.40? Please an “X” in the appropriate box:
|
Yes |
No |
|
|
|
Question 2: You have two variables: 1) Death rate by state and 2) Percent of popular vote won by Donald Trump by state. Which is the independent variable and which is the dependent variable? Enter your answer in the table below:
|
Variable |
Independent or Dependent? |
|
Death Rate by State |
|
|
Popular Vote Won By Trump |
|
explain your answer
Question 3: Using Microsoft Excel: (Excel file Assignment10.xlsx)
- Calculate the mean and sample standard deviation of both the independent and dependent variables.
- Calculate the correlation coefficient, r, using Excel’s CORREL
function . Explain what it means. - Calculate the coefficient of determination, r2, using Excel’s RSQ function. Explain what it means. a very high score.
Report your results here:
Paste your Excel table here using Word’s Paste Special function.
|
|
- Coefficient of correlation means:
Interpret the coefficient of correlation using this table.
|
Negative |
Positive |
Meaning |
|
0.00 to -0.099 |
0.00 to -.099 |
No Correlation |
|
-0.10 to -0.299 |
0.10 to 0.299 |
Small Correlation |
|
-0.30 to -0.499 |
0.30 to 0.499 |
Medium Correlation |
|
-0.50 to -1.000 |
0.50 to 1.000 |
Large Correlation |
- Coefficient of determination means:
|
|
Question 4: Using Excel, conduct a NHST to determine whether there is a correlation in the population. Use a 0.05 significance level. Use the Excel file: Assignment8_Spring22.xlsx
- Test Set-Up: What type of Null Hypothesis Test should you use? Is this a left-tailed, two-tailed, or right-tailed test? Place an “X” in the appropriate box:
|
Left-Tail |
|
|
Two-Tail |
|
|
Right-Tail |
|
This is a t-test to determine whether there is a correlation in the population. Here is the formula for the Test Statistic:
- What is/are the critical value(s) for t? Degrees of freedom equals n – 2. Use a 5% significance level.
How many critical values are there? Place an “X” in the appropriate box:
|
One |
Two |
|
|
|
What is (are) the critical value(s)? Round off your answer to three digits passed the decimal point. Enter the value or values in this box:
|
|
- Write the Null & Alternate Hypotheses (Follow the examples shown in Clear-Sighted Statistics. Use the appropriate Greek letters and mathematical symbols).
|
H0: |
|
|
H1: |
|
Here are the Greek Letters and mathematical symbols. Copy and paste the correct symbols.
|
Mathematical Symbols |
|||||
|
= |
≤ |
≥ |
≠ |
> |
< |
|
Greek Letters |
|||||
|
μ |
π |
σ |
ρ |
Σ |
ν |
Model your answer on the examples shown in Clear-Sighted Statistics.
- Write the Decision Rule using the Critical Value(s), not p-values. Model your answer on the examples shown in Clear-Sighted Statistics. Failure to do so will result in a major reduction of your grade.
|
Critical Value(s): |
|
|
Decision Rule: |
|


Trending now
This is a popular solution!

Step by step
Solved in 7 steps with 6 images


