The regional transit authority for a major metropolitan area wants to determine whether there is a relationship between the age of a bus and the annual maintenance cost. A sample of 10 buses resulted in the following data. Age of Bus (years) Annual Maintenance Cost (5) 350 370 1 2 2 2 2 3 4 4 5 5 480 520 $90 550 750 800 790 950 (a) Develop a scatter chart for these data. What does the scatter chart indicate about the relationship between age of a bus and the annual maintenance cost? The scatter chart indicates there may be no noticeable linear relationship between age of bus and annual maintenance cost The scatter chart indicates there may be a negative linear relationship between age of bus and annual maintenance cost. O The scatter chart indicates there may be a positive linear relationship between age of bus and annual maintenance cost. (b) Use the data to develop an estimated regression equation that could be used to predict the annual maintenance cost in dollars () given the age of the bus in years (e). What is the estimated regression model? (Round your numerical values to two decimal places) 9-220+132x (c) Test whether the regression parameter is equal to zero at a 0.05 level of signe Find the p-value. (Round your answer to four decimal places)
The regional transit authority for a major metropolitan area wants to determine whether there is a relationship between the age of a bus and the annual maintenance cost. A sample of 10 buses resulted in the following data. Age of Bus (years) Annual Maintenance Cost (5) 350 370 1 2 2 2 2 3 4 4 5 5 480 520 $90 550 750 800 790 950 (a) Develop a scatter chart for these data. What does the scatter chart indicate about the relationship between age of a bus and the annual maintenance cost? The scatter chart indicates there may be no noticeable linear relationship between age of bus and annual maintenance cost The scatter chart indicates there may be a negative linear relationship between age of bus and annual maintenance cost. O The scatter chart indicates there may be a positive linear relationship between age of bus and annual maintenance cost. (b) Use the data to develop an estimated regression equation that could be used to predict the annual maintenance cost in dollars () given the age of the bus in years (e). What is the estimated regression model? (Round your numerical values to two decimal places) 9-220+132x (c) Test whether the regression parameter is equal to zero at a 0.05 level of signe Find the p-value. (Round your answer to four decimal places)

Big Ideas Math A Bridge To Success Algebra 1: Student Edition 2015
1st Edition
ISBN:9781680331141
Author:HOUGHTON MIFFLIN HARCOURT
Publisher:HOUGHTON MIFFLIN HARCOURT
Chapter11: Data Analysis And Displays
Section11.5: Choosing A Data Display
Problem 19E

Related questions
Question
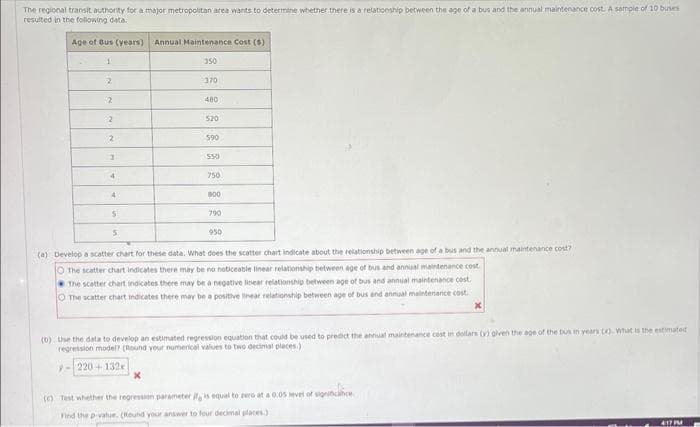
Transcribed Image Text:The regional transit authority for a major metropolitan area wants to determine whether there is a relationship between the age of a bus and the annual maintenance cost. A sample of 10 buses
resulted in the following data.
Age of Bus (years) Annual Maintenance Cost (5)
1
350
370
2
2
2
2
3
4
4
S
5
480
520
590
550
750
800
790
950
(a) Develop a scatter chart for these data. What does the scatter chart indicate about the relationship between age of a bus and the annual maintenance cost?
The scatter chart indicates there may be no noticeable linear relationship between age of bus and annual maintenance cost
The scatter chart indicates there may be a negative linear relationship between age of bus and annual maintenance cost.
O The scatter chart indicates there may be a positive linear relationship between age of bus and annual maintenance cost.
(b) Use the data to develop an estimated regression equation that could be used to predict the annual maintenance cost in dollars () given the age of the bus in years (e). What is the estimated
regression model? [Round your numerical values to two decimal places.)
9-220+132x
(c) Test whether the regression parameter is equal to zero at a 0.05 level of signce
Find the p-value. (Round your answer to four decimal places)
417 PM
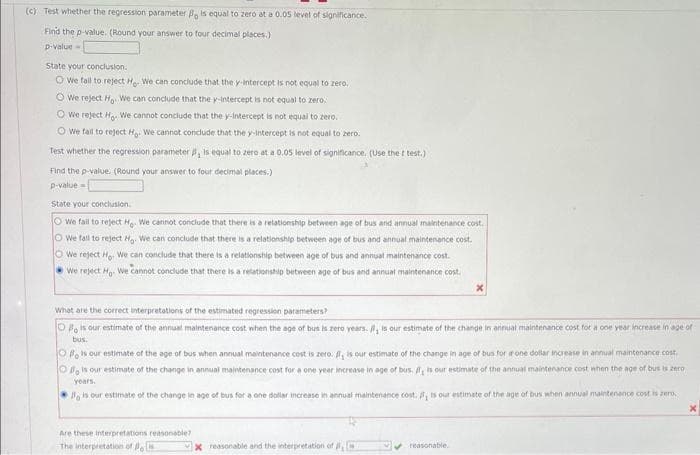
Transcribed Image Text:(c) Test whether the regression parameter , is equal to zero at a 0.05 level of significance.
Find the p-value. (Round your answer to four decimal places.)
p-value-
State your conclusion.
Owe fail to reject He We can conclude that the y-intercept is not equal to zero.
O We reject Ho We can conclude that the y-intercept is not equal to zero.
Owe reject H. We cannot conclude that the y-intercept is not equal to zero.
Owe fail to reject Ho We cannot conclude that the y-intercept is not equal to zero.
Test whether the regression parameter , is equal to zero at a 0.05 level of significance, (Use the t test.)
Find the p-value. (Round your answer to four decimal places.)
p-value=
State your conclusion.
We fail to reject He. We cannot conclude that there is a relationship between age of bus and annual maintenance cost.
O We fall to reject Hg. We can conclude that there is a relationship between age of bus and annual maintenance cost.
O We reject Ho. We can conclude that there is a relationship between age of bus and annual maintenance cost.
We reject Ho. We cannot conclude that there is a relationship between age of bus and annual maintenance cost.
What are the correct interpretations of the estimated regression parameters?
O is our estimate of the annual maintenance cost when the age of bus is zero years. , is our estimate of the change in annual maintenance cost for a one year increase in age of
bus.
O is our estimate of the age of bus when annual maintenance cost is zero. f, is our estimate of the change in age of bus for if one dollar increase in annual maintenance cost
O
is our estimate of the change in annual maintenance cost for a one year increase in age of bus. f, is our estimate of the annual maintenance cost when the age of bus is zero
years.
is our estimate of the change in age of bus for a one dollar increase in annual maintenance cost. , is our estimate of the age of bus when annual maintenance cost is zero
Are these interpretations reasonable?
The interpretation of Po
x reasonable and the interpretation of C
reasonable.
X
Expert Solution
This question has been solved!
Explore an expertly crafted, step-by-step solution for a thorough understanding of key concepts.

This is a popular solution!

Trending now
This is a popular solution!

Step by step
Solved in 5 steps with 2 images

Recommended textbooks for you
Big Ideas Math A Bridge To Success Algebra 1: Stu…
Algebra
ISBN:
9781680331141
Author:
HOUGHTON MIFFLIN HARCOURT
Publisher:
Houghton Mifflin Harcourt
Big Ideas Math A Bridge To Success Algebra 1: Stu…
Algebra
ISBN:
9781680331141
Author:
HOUGHTON MIFFLIN HARCOURT
Publisher:
Houghton Mifflin Harcourt