using the graph Which of the following are correct? I. The 30th percentile is a test score of about 80. II. About 10% of the students scored above a 40. III. The IQR is about 23. Question 1 options: a) II and III b) III only c) I, II and III d) I and III
using the graph Which of the following are correct? I. The 30th percentile is a test score of about 80. II. About 10% of the students scored above a 40. III. The IQR is about 23. Question 1 options: a) II and III b) III only c) I, II and III d) I and III

Glencoe Algebra 1, Student Edition, 9780079039897, 0079039898, 2018
18th Edition
ISBN:9780079039897
Author:Carter
Publisher:Carter
Chapter10: Statistics
Section10.6: Summarizing Categorical Data
Problem 4AGP

Related questions
Question
using the graph Which of the following are correct?
I. The 30th percentile is a test score of about 80.
II. About 10% of the students scored above a 40.
III. The IQR is about 23.
I. The 30th percentile is a test score of about 80.
II. About 10% of the students scored above a 40.
III. The IQR is about 23.
Question 1 options:
|
|
|
||
|
|
|
||
|
|
|
||
|
|
|
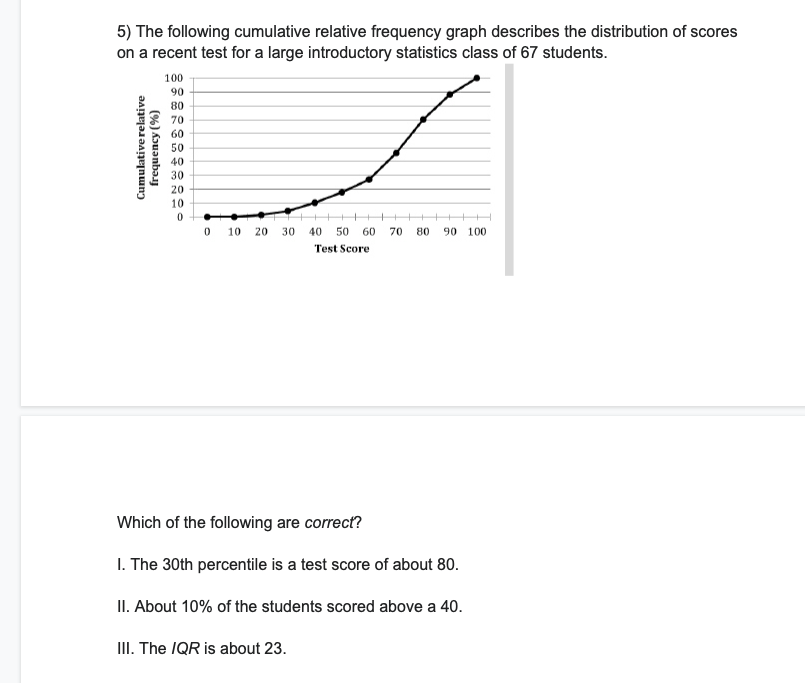
Transcribed Image Text:5) The following cumulative relative frequency graph describes the distribution of scores
on a recent test for a large introductory statistics class of 67 students.
Cumulative relative
frequency (%)
100
90
80
70
60
50
40
30
20
10
0
0 10 20 30 40 50 60 70 80 90 100
Test Score
Which of the following are correct?
1. The 30th percentile is a test score of about 80.
II. About 10% of the students scored above a 40.
III. The IQR is about 23.
Expert Solution
This question has been solved!
Explore an expertly crafted, step-by-step solution for a thorough understanding of key concepts.

Step by step
Solved in 2 steps with 3 images

Recommended textbooks for you
Glencoe Algebra 1, Student Edition, 9780079039897…
Algebra
ISBN:
9780079039897
Author:
Carter
Publisher:
McGraw Hill
Glencoe Algebra 1, Student Edition, 9780079039897…
Algebra
ISBN:
9780079039897
Author:
Carter
Publisher:
McGraw Hill