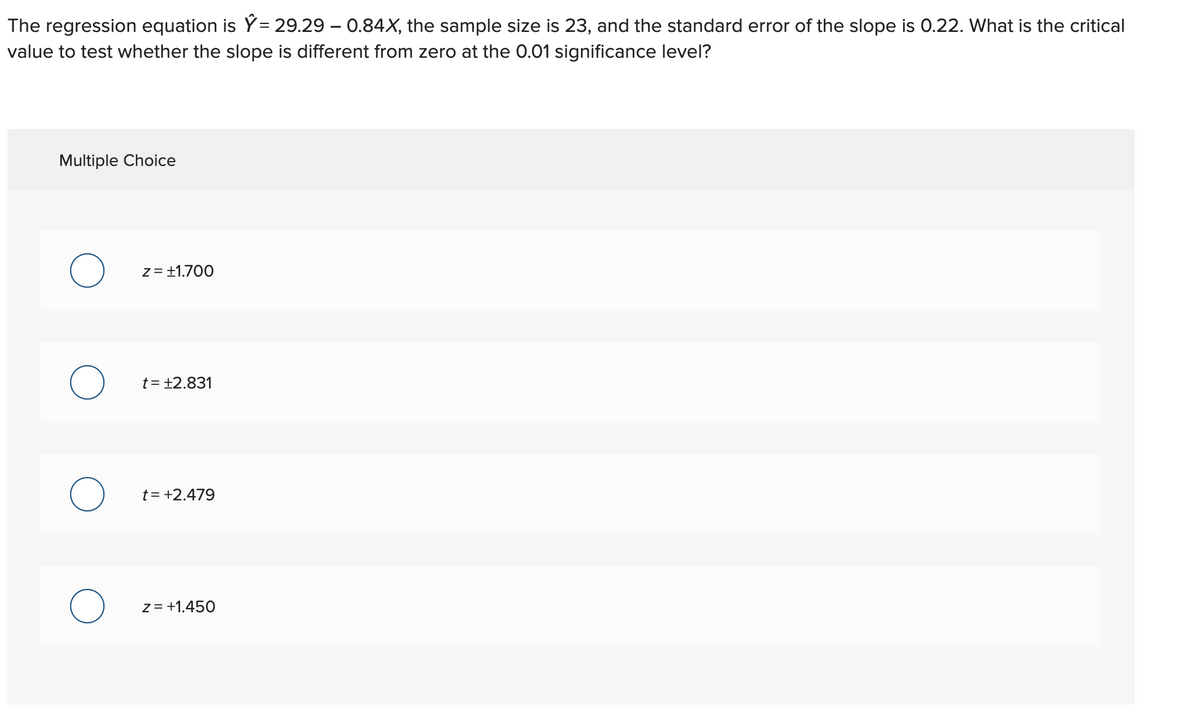
The regression equation is Ý= 29.29 – 0.84X, the sample size is 23, and the standard error of the slope is 0.22. What is the critical value to test whether the slope is different from zero at the 0.01 significance level?


Q: In a simple regression, if MSR=6400 and MSE=100, then the t statistic that we use to test the…
A: It is given that MSR=6400 and MSE=100.
Q: A researcher is going to conduct a regression line and created the following scatter plot that…
A: After visualizing this scatter plot we can say that, this points does not show linear pattern .…
Q: Consider a linear regression with a slope of –1.64, the residual mean square is 3.6, the sum of…
A: Note: As per my policy i can answer only three sub parts. kindly repost the remaining sub parts.…
Q: In a simple linear regression you are told that the estimate of the slope coefficient was 0.7 and…
A: Given slope coefficient was 0.7 t-statistic=-2.7 Given β=1
Q: Along with the slope and the intercept, compute the standard erron of the estimate and the…
A: The slope and intercept are calculated below: Excel Procedure: Enter X and Y in Excel Go to Data…
Q: In a simple linear regression you are told that the estimate of the slope coefficient was 0.5 and…
A: Given data, test statistic (t) = -2.5 slope (b1) = 0.5
Q: Adjusted-R2 can be used to compare the of regressions with the same dependent riable.
A: Note: Hi there! Thank you for posting the question. As you have posted multiple questions, as per…
Q: a) Using simple linear regression, find the forecasted quantity sold for Jiga Milk Tea if the price…
A: We have given there are two variable namely Price RM & Quantity sold in the table. Let us…
Q: In a linear regression model, calculate the slope of the line, b1, when the correlation coefficient…
A: The formula to calculate slope of line is as follows : b1 = r×sysx
Q: PLease help!
A: Given strong positive correlation between number of hours of binge watching Sesame street (X) and…
Q: which of the following regressions represents the strongest negative linear relationship between x…
A: The correlation coefficient r is used to measure the linear relationship between two variables X and…
Q: For a linear regression for a sample of n=20 pairs of X and Y values. What is the value of the…
A:
Q: Calculate for the coefficient b in the linear regression equation describing the sample data
A: The equation of regression line is given by: y = a + bx Here, 'a' is the y-intercept and 'b' is the…
Q: 9. In a simple regression, which would suggest a significant relationship between X and Y? A) Large…
A: In regression analysis, the slope (b) tells us the direction of the linear relationship between the…
Q: A multiple linear regression model based on a sample of 18 weeks is developed to predict standby…
A:
Q: A sample of n = 15 pairs of X and Y scores produces a Pearson correlation of r = 0.45, SSY = 90. a)…
A:
Q: In a simple linear regression you are told that the estimate of the slope coefficient was 0.9 and…
A: Obtain the estimated standard error for the estimated slope coefficient. The estimated standard…
Q: Which of the following is(are) TRUE about the simple linear regression model to describe the…
A: Here use relation of slope and correlation coefficient
Q: A marketing manager conducted a study to determine the…
A: Given Information: Intercept = 104.062 Slope = 50.730 R-squared value is 0.8340
Q: 1. What is the correlation of the correlation coefficient for the bivariate data? [Select] 2. Is…
A: The provided information is x y xy x2 y2 1.2 6.7 8.04 1.44 44.89 1.5 7.8 11.7 2.25 60.84…
Q: In a regression context, under what situation is the predicted value for Y equal to the mean of Y?
A: To find: under what situation is the predicted value for Y equal to the mean of Y Let us assume…
Q: Suppose you are investigating a dataset and creating a sample linear regression model that yields a…
A: Researchers conduct t-test to test the usefulness of the slope coefficient.
Q: If the linear correlation coefficient between the explanatory variable (x) and response variable (y)…
A:
Q: Set up the regression equation and calculate the predicted satisfaction with major for someone with…
A:
Q: The Linear regression is used to predict Y from X in a certain population. In this population, SSY…
A:
Q: A set of n=20 pairs of x and y scores had SSx=10,SSy=40,and SP=30.What is the slope for the…
A: Given : n=20SSx=10SSy=40SP=30We want to find, the value of slop for regression equation for…
Q: The regression equation is Ŷ = 29.29 − 0.58X, the sample size is 10, and the standard error of the…
A: It is given that the regression line is Y^=29.29-0.58X. The sample size is n=10. The level of…
Q: Suppose you are interested in estimating the ceteris paribus relationship between final exam scores…
A: Given information: The investigator is specially interested in estimating the ceteris paribus…
Q: The regression equation is Ý = 29.29 – 0.96X, the sample size is 8, and the standard error of the…
A: Given that Sample size n = 8 Standard error of slope = 0.22 Level of significance = 0.01
Q: As part of your job as a sales manager for a local car dealership, you want to investigate the…
A:
Q: A regional retailer would like to determine if the variation in average monthly store sales can, in…
A: When we want to estimate an impact of one variable another variable at that time we use the…
Q: The mean height of American women in their twenties is about 64.3 inches, and the standard deviation…
A: Let X denotes height of American women And Y denotes height of American men. Given:
Q: 4. Find the regression equation for predicting final score from midterm score, based on the…
A: For solution number 4 Given: y¯f=70sf=10x¯m=55sm=20r=0.60
Q: b. Using a = 0.10, determine if the slope for the regression equation is statistically significant.…
A: The data shows the amount of time in minutes a purchaser spends on its Web site and the amount of…
Q: A regression model to predict Y, the state burglary rate per 100,000 people, used the following four…
A: a) The number of independent variables is 4. The sample size n is 45. The degrees of freedom is…
Q: For a simple linear regression model, if the coefficient of correlation is 0.75, what does the…
A:
Q: After performing a statistical regression on a set of data the value of the correlation coefficient…
A: Correlation: The extent linear relation between the two variables is called as correlation. Positive…
Q: Using a sample of recent university graduates, you estimate a simple linear regression using initial…
A: The regression model has an estimated intercept of 3200 and an estimated slope coefficient of 550.…
Q: If we are interested in the normality assumption in the context of regression, should we be…
A: Regression analysis
Q: 2. From the regression results, what would you conclude about a) airframe vs engine costs for each…
A: Hello. Since your question has multiple sub-parts, we will solve first three sub-parts for you. If…
Q: For the regression equation, Ŷ = –2X + 6, if the X value is above the mean (positive deviation),…
A: We have to find correct statement for y.
Q: One set of 20 pairs of scores, X and Y values, produces a correlation of r = 0.70. If SSY = 150,…
A: Given values, n=20r=0.70SSy=150
Q: What would the consequence be for a regression model if the errors were not homoscedastic?
A:
Q: If the R-squared for a regression model relating the outcome y to an explanatory variable x is 0.9.…
A: It is an application of statistics . It is highly useful in correlation as well as regression…
Q: True or false? If the statement is false, use one or two sentences to justify your answer.
A: The provided regression equation indicates that the slope of X1 is -2 which indicates that one unit…
Q: When should a regression model not be used to make a prediction?
A: Not using regression model to make prediction when: there are few point which should be like that
Q: In a simple linear regression you are told that the estimate of the slope coefficient was 0.9 and…
A: Given, t-statistic = -3.6 Testing whether slope parameter = 1 or not Estimated slope coefficient =…
Q: Using the previous regression model, is there a statistically significant relationship between GPA…
A: Given : Significance level α = 0.05 We are asked to determine if there is statistically significant…
Q: 3)A paper reported that a simple linear regression model was built based on 24 samples. The 95%…
A: Since your question has multiple sub-parts, we will solve first three sub-parts for you. If you want…


Trending now
This is a popular solution!

Step by step
Solved in 2 steps

- For the following exercises, use Table 4 which shows the percent of unemployed persons 25 years or older who are college graduates in a particular city, by year. Based on the set of data given in Table 5, calculate the regression line using a calculator or other technology tool, and determine the correlation coefficient. Round to three decimal places of accuracyThe regression equation is Ŷ = 29.29 − 0.58X, the sample size is 10, and the standard error of the slope is 0.22. What is the critical value to test whether the slope is different from zero at the 0.01 significance level? Multiple Choice z = ±2.224 z = +1.974 t = +3.003 t = ±3.355find the (a) explained variation, (b) unexplained variation, and (c) indicated prediction interval. In each case, there is sujficient evidence to support a claim of a linear correlation, so it is reasonable to use the regression equation when making predictions. Altitude and Temperature Listed below are altitudes (thousands of feet) and outside air temperatures (°F) recorded by the author during Delta Flight 1053 from New Orleans to Atlanta. For the prediction interval, use a 95% confidence level with the altitude of 6327 ft (or 6.327 thousand feet).
- A sociologist was hired by a large city hospital to investigate the relationship between the number of unauthorized days that employees are absent per year and the distance (miles) between home and work for the employee. A sample of 10 employees was chosen, and the following data were collected. A. Is the estimated regression equation appropriate and adequateThe accompanying technology output was obtained by using the paired data consisting of foot lengths (cm) and heights (cm) of a sample of 40 people. Along with the paired sample data, the technology was also given a foot length of 14.5 cm to be used for predicting height. The technology found that there is a linear correlation between height and foot length. If someone has a foot length of 14.5 cm, what is the single value that is the best-predicted height for that person? The regression equation is Height=64.8+5.70 Foot Length Predictor Coef SE Coef T P Constant 64.79 11.98 5.41 0.000 Foot Length 5.7004 0.4126 13.82 0.000 S=5.50488 R-Sq=70.6% R-Sq(adj)=69.8% Predicted Values for New Observations New Obs Fit SE Fit 95% CI 95% PI 1 147.446 1.796 (143.130, 151.762) (135.900, 158.992) Values of Predictors for New Observations New Obs Foot Length 1 14.5…The accompanying technology output was obtained by using the paired data consisting of foot lengths (cm) and heights (cm) of a sample of 40 people. Along with the paired sample data, the technology was also given a foot length of 21.4 cm to be used for predicting height. The technology found that there is a linear correlation between height and foot length. If someone has a foot length of 21.4 cm, what is the single value that is the best-predicted height for that person? The regression equation is Height=52.3+4.58 Foot Length Predictor Coef SE Coef T P Constant 52.33 11.01 4.75 0.000 Foot Length 4.5818 0.4872 9.40 0.000 S=5.50437 R-Sq=70.8% R-Sq(adj)=70.0% Predicted Values for New Observations New Obs Fit SE Fit 95% CI 95% PI 1 150.381 1.722 (146.730, 154.032) (138.758, 162.004) Values of Predictors for New Observations New Obs Foot Length 1 21.4 The…
- Would someone familiar with SPSS be able to help me complete the table and the questions? (a) Explain which of the variables have statistically significant effects at the α = 0.05 level. (b) Are the conclusions different to the results obtained by univariate regression? Explain why and which approach is likely to be preferable?What is the sample regression equation (round to 2 decimal places)? y = + Education + Experience + Age What is the hourly wage for a 30-year-old worker with 4 years of higher education and 3 years of experience (round to 2 decimal places)? Are any independent variables insignificant?suppose that you want to conduct a study on the relationship between women's shoe sizes and their height, and you have collected samples of female undergraduates at your university. The mean height of women in your sample is 64 inches, with a standard deviation of 2 inches. The mean shoe size is 8, with a standard deviation of 1. The correlation between the shoe size and height in your sample is .05. What is the least squares estimate of the slope parameter in your regression model?
