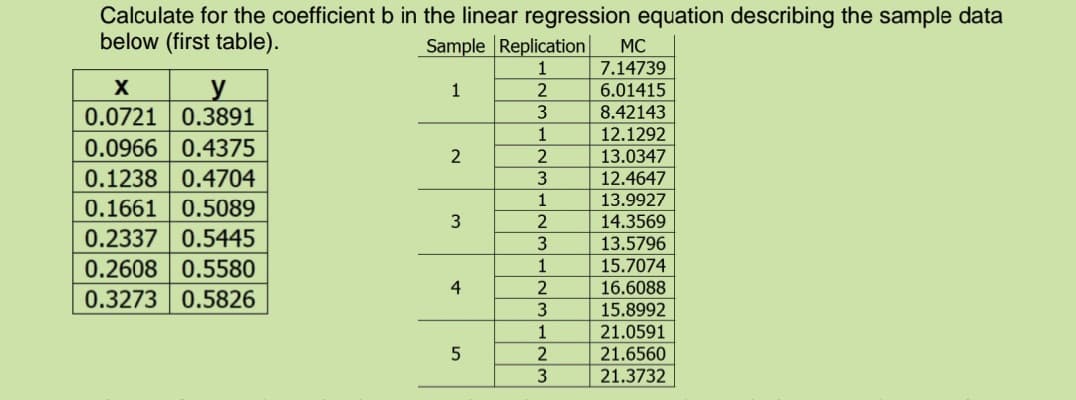
Calculate for the coefficient b in the linear regression equation describing the sample data


Q: Suppose you want to evaluate the effectiveness of a job training program using twage - Bo + Bprogram…
A: Given information: The two regression equations for predicting the response variable wage are as…
Q: This regression line, Calculate the standard error of estimate for these data points.
A: Standard error of estimate is an important statistic to measure the accuracy of the predictions.
Q: Suppose that you are estimating the simple regression model Y; = B1 + B2X; + ui, and in your sample,…
A:
Q: A researcher collected statistics on the sales amount of a product in 120 different markets and the…
A: a) Since Sales is dependent on advertising through TV, Newspaper and Radio, Hence, Sales should be…
Q: Along with the slope and the intercept, compute the standard erron of the estimate and the…
A: The slope and intercept are calculated below: Excel Procedure: Enter X and Y in Excel Go to Data…
Q: 1. Which assumption regarding the population residuals of linear regression models is necessary for…
A: According to guidelines i solve only first question if u want answer of second question send again…
Q: Explain how to determine the variance ination factor (VIF) for a predictor variable x1 in a…
A: Variance inflation factor:Variance inflation factor of a variable is the ratio of the variance of…
Q: To estimate the value of a dependent variable based on the values of one or more independent…
A: Solution-: To estimate the value of a dependent variable based on the value of one or more…
Q: Use the Third Paired Data Set. Find the equation for the least-squares regression line.
A: 34. Excel Procedure: Enter x and y in Excel>Data>Data Analysis> ‘Regression’>Select y…
Q: The model developed from sample data that has the form of Yhat = bo +b1X is known as the multiple…
A: The model developed from the sample data that has the form of y^=b0+b1×X is known as the multiple…
Q: In a simple linear regression, show that the OLS regression line always passes through the mean…
A: Let, yi=a+bxi+ui be the population regression line and yi=a^+b^xi+ei^ be the sample regression…
Q: Develop the equation of the simple linear regression line for this data. Then, give a brief…
A: Hello! As you have posted more than 3 sub parts, we are answering the first 3 sub-parts. In case…
Q: Define Linear Regression Errors?
A: The residual or errors is defined as the difference between the observed value of the dependent…
Q: The three pieces of information that the standard error for slope is dependent on in an inference of…
A:
Q: Using the data given in the Question about Correlation between numbers of commuters and numbers of…
A: The regression line used to predict the variable over the unit change. The regression will be…
Q: Explain various Assumptions of the Fixed Effects Regression ?
A: The fixed effect principle is that the independent variables are correlated with the…
Q: 2. For a linear regression model including only an intercept, the OLS estimator of that intercept is…
A: We have given that For a linear regression model including only an intercept, the OLS estimator of…
Q: Which criterion is used for deciding which regression line fits best?
A: Least-squares property: If the sum of the squares of the residuals is expressed as smallest sum…
Q: The regression equation is intended to be the “best fitting” straight line for a set of data. What…
A: There can be many lines that can relate the independent and the dependent variables. But one of the…
Q: "In regression, the sum of squared error used for generating a regression line is"
A: Regression is used to find the relationship between one dependent variable and one or more…
Q: Define familiar multiple regression model with a population regression function?
A: A multiple regression model is a statistical technique that uses several independent variables to…
Q: The regression equation is Ý= 29.29 – 0.84X, the sample size is 23, and the standard error of the…
A: The sample size n is 23.
Q: The fish in my pond have mean length of 10.78 inches and mean weight 4.27 pounds. The correlation…
A: the regression equation of y on x is given as : y^ - y¯ = byx (x - x¯) let us assume: y: the…
Q: A process by which we estimate the value of dependent variable on the basis of one or more…
A: Regression is the process in which we find the value of a dependent variable on the basis of one or…
Q: What is the interpretation of the coefficient of determination in a simple linear regression
A: What is the interpretation of the coefficient of determination in a simple linear regression model?
Q: State the four conditions required for making regression inferences.
A:
Q: What is a numerical prediction from the regression line equation shown in the photo?
A: Here, the regression line equation is " Height ( in. ) = 52.293743 + 1.3679745 Shoe size ( in. ) ".…
Q: It is considered that the number of employees in the enterprise affects the number of production.…
A: Given: X Y 14 124 17 165 13 110 18 220 21 265 16 150
Q: A prediction equation for starting salaries (in $1,000s) and SAT scores was performed using simple…
A: From the given information, the p-value for SAT is 0.0000242.
Q: Two regression lines of a sample are X+6 Y=6 and 3X+2Y=0. Find the correlation coefficient.
A:
Q: Define "regression coefficient"?
A:
Q: Calculate the equation of the regression line and calculate the correlation coefficient
A: Correlation is used to measure the mean significance between the two numerical variable. It take…
Q: Find the simple regression line y=α+βx for the pairs of points belonging to the independent and…
A:
Q: in multiple regression analysis, a residual is the difference between the value of a dependent…
A: We know that, In any regression model, Residual is the difference between the value of a dependent…
Q: What is the prediction interval equation for multiple linear regression when given σ ?
A: Prediction interval for multiple linear regression is given by Prediction interval
Q: Define regression line
A: Suppose ,we have 2 variables X and Y, out of which we want to know if there is any linear dependency…
Q: What is the simple regression line that can best predict the sales from the advertising expenditures…
A:
Q: Calculate an estimate of the error standard deviation in the simple regression model
A: Given data, x y 112.3 75.2 97 70.7 92.7 57.9 86 48.5 102 73.9 99.2 73.3 95.8 68.1…
Q: What are the Standard Errors for Fixed Effects Regression?
A:
Q: Find the equation of the least squares regression line considering Marijuana Use as the Explanatory…
A: The mean percent of teens that use marijuana is 23.9, and standard deviation is 15.6. The mean…
Q: The maintenance manager at a trucking company wants to build a regression model to forecast the time…
A: Multiple linear regression model: A multiple linear regression model is given as y = b0 + b1x1 +…
Q: The fish in my pond have mean length 12 inches and mean weight 5 pounds. The correlation…
A: In this case, weight is the dependent variable (y) and length is the independent variable (x).
Q: If the coefficient of determination of a simple regression equation is 0.81, the correlation…
A: Correlation coefficient is the square root of coefficient of determination.
Q: The following table shows the starting salary and profile of a sample of 10 employees in a certain…
A: Here, the dependent variable is, Starting salary and the independent variables are GPA,years of…
Q: a. If the sample correlation coefficient between X and Y is positive, then the slope of the…
A: a. If the sample correlation coefficient between X and Y is positive, then the slope of the…
Q: Define Residuals or errors in Alternative Regression Models?
A: The residual or errors is defined as the difference between the observed value of the dependent…
Q: The fish in my pond have mean length 10 inches and mean weight 4 pounds. The correlation coefficient…
A: In the given question, mean values of length and weight and correlation coefficient are specified.…
Q: A random sample of some of the heaviest carnivores on Earth was reviewed to determine if there is an…
A: Since we only do up to three sub parts of a problem, we'll be doing the first three subparts. Please…
Q: suppose that you want to conduct a study on the relationship between women's shoe sizes and their…
A: Let X=women height. Y-women shoe size. given, X =64…

Step by step
Solved in 3 steps with 2 images

- Olympic Pole Vault The graph in Figure 7 indicates that in recent years the winning Olympic men’s pole vault height has fallen below the value predicted by the regression line in Example 2. This might have occurred because when the pole vault was a new event there was much room for improvement in vaulters’ performances, whereas now even the best training can produce only incremental advances. Let’s see whether concentrating on more recent results gives a better predictor of future records. (a) Use the data in Table 2 (page 176) to complete the table of winning pole vault heights shown in the margin. (Note that we are using x=0 to correspond to the year 1972, where this restricted data set begins.) (b) Find the regression line for the data in part ‚(a). (c) Plot the data and the regression line on the same axes. Does the regression line seem to provide a good model for the data? (d) What does the regression line predict as the winning pole vault height for the 2012 Olympics? Compare this predicted value to the actual 2012 winning height of 5.97 m, as described on page 177. Has this new regression line provided a better prediction than the line in Example 2?1a. Develop an estimated regression equation for these data. 1b. Compute the residuals and standardized residualsrandomly selected middle school students. Using this data, consider the equation of the regression line, yˆ=b0+b1x, for predicting the overall grade average for a middle school student based on the number of hours spent unsupervised each day. Keep in mind, the correlation coefficient may or may not be statistically significant for the data given. Remember, in practice, it would not be appropriate to use the regression line to make a prediction if the correlation coefficient is not statistically significant. Hours Unsupervised 1.5 2 3 3.5 4 4.5 5.5 Overall Grades 99 96 84 75 68 65 60 Table Step 1 of 6 : Find the estimated slope. Round your answer to three decimal places.
- randomly selected middle school students. Using this data, consider the equation of the regression line, yˆ=b0+b1x, for predicting the overall grade average for a middle school student based on the number of hours spent unsupervised each day. Keep in mind, the correlation coefficient may or may not be statistically significant for the data given. Remember, in practice, it would not be appropriate to use the regression line to make a prediction if the correlation coefficient is not statistically significant. Hours Unsupervised 1.5 2 3 3.5 4 4.5 5.5 Overall Grades 99 96 84 75 68 65 60 Table Find the estimated slope, y interscept and correlation coefficient Round your answers to three decimal places.14.Calculate for the coefficient b in the linear regression equation describing the sample data below.A sample of 40 individuals collects their shoe size and the height (cm) for CSI data. The scatter plot and results from a simple linear regression are recorded: HEIGHT = 126.76238 + 4.8782178 SHOE SIZE Sample size: 40R (correlation coefficient) = 0.77918855P-value < 0.0001 (a) Does the scatterplot and results show a linear correlation between shoe size and height? (b) How can you tell? (c) Will it be appropriate to use the linear regression equation given in the output? (d) Krusty the Clown wears size 8.5 shoes. According to the linear regression equation, how tall is Krusty the Clown? (e) Sideshow Bob wears size 14 shoes. According to the linear regression equation, how tall is Sideshow Bob?

