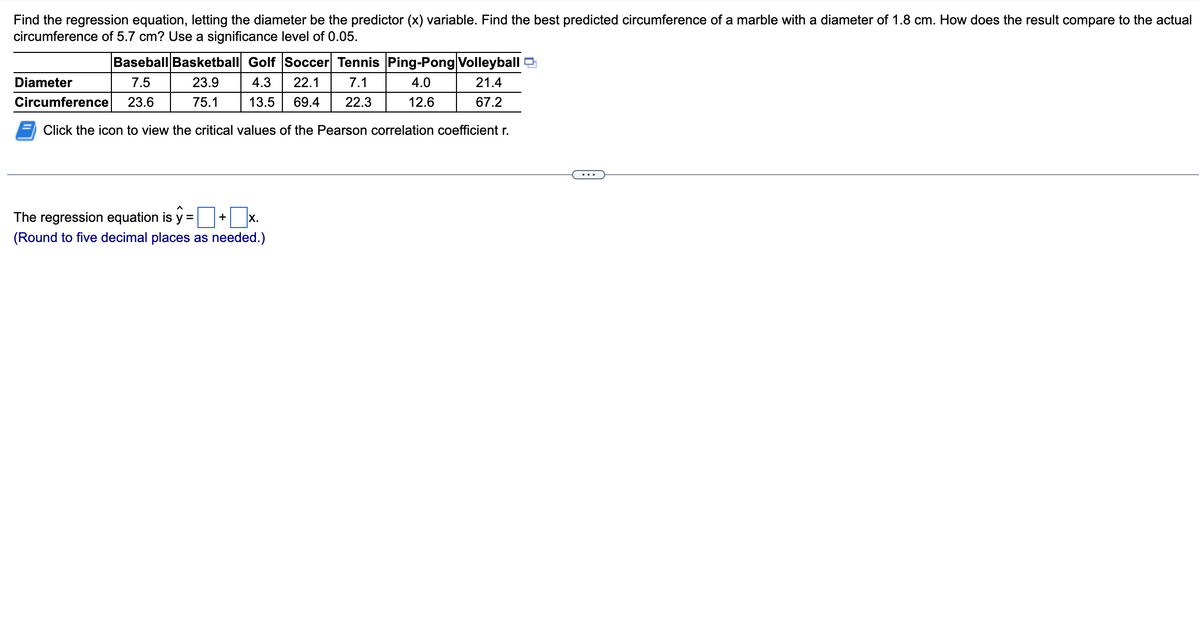
The regression equation is ŷ=+x. (Round to five decimal places as needed.)


Q: What is the probability of getting 53 Mondays in a leap year?
A:
Q: A group of students estimated the length of one minute without reference to a watch or clock, and…
A: From the provided information, Sample size (n) = 15 Level of significance (α) = 0.10
Q: Suppose you like to keep a jar of change on your desk. Currently, the jar contains the following: 17…
A: Given Total =19(Nickel)+17(pennies)+10(Dimes)+21(Quarter) =67
Q: Suppose that 10% of the fields in a given agricultural area are infested with the sweet potato…
A: From given data we have : n=100 x=40 Sample Prop. p^=xn=40100=0.4
Q: (e) Convert the data to centimeters (1 inch=2.54 cm), and recompute the linear correlation…
A:
Q: Suppose that in a random selection of 100 colored candies, 28% of them are blue. The candy company…
A: Given information: claim: The candy company claims that the percentage of blue candies is equal to…
Q: 1. It has been noted that there is a positive correlation between the U.S. economy and the height of…
A: Given that: # of Absences (in weeks), X Exam Grade, Y 2 90 3 85 0 95 1 92 4 80
Q: If X is a Poisson variate such that 4) + 90 P(X=6), find the P(X=2)=9P variance (X =
A:
Q: Assume that the sample is a simple random sample obtained from a normally distributed population of…
A: In the question we need to find the minimum sample size needed at 95% confidence such that the value…
Q: Is there any nominal scale?
A: A Nominal Scale is a measurement scale, in which numbers serve as tags or labels
Q: The true class start time, X, after schedule , has the following cumulative distribution function F:…
A: Note: Hey, since multiple subparts are posted, we will answer first three subparts according to our…
Q: A local company wants to evaluate their quality of service by surveying their customers. Their budge…
A: given data n = 250 95% ci for mean σ = 13E = ?
Q: Calculate the lower endpoint of a two-sided 95% confidence interval for the population mean using…
A: given data sample size (n) = 32sample mean ( x¯ ) = 0.485sample standard deviatio (s) = 0.36995% ci…
Q: You are asked to evaluate another new test for earlier detection of head and neck cancer. In total,…
A: The question is sensitivity and specificity Given : Total no. of people who tested +ve = 500 Total…
Q: A pediatrician wants to determine the relation that exists between a child's height, x, and head…
A: Given information: x y x^2 y^2 xy 27.75 17.8 770.0625 316.84 493.95 24.75 17.3 612.5625…
Q: .The time (in hours) required to repair a machine is exponentially distributed with parameter ==…
A: Given,A random variable X~exponential(λ=12)f(x)=12e-x2 ; x≥0and cumulative distribution…
Q: Listed below are student evaluation ratings of courses, where a rating of 5 is for "excellent."…
A: Given3.7,3.1,4.0,4.7,3.2,4.4,3.5,4.5,4.6,4.4,4.6,4.0,3.4,3.8,3.5sample size(n)=15confidence…
Q: Question 2 a. In a pastry shop in a small town, the probability that a customer buys apple tarts is…
A: As per our guidelines we are suppose to answer only one question. Let T= a customer buys apple tarts…
Q: Goochland Regional Bank has three branch offices in Goochland County, Virginia. The bank has a…
A: The objective is to test whether the differences in mean time employees took for sick leave at the…
Q: Two cards are drawn without replacement from a standard deck of 52 playing cards. What is the…
A:
Q: If X is Uniformly distributed in ДЛ 2 .Find the p.d.f of Y=tan X.
A:
Q: According to the Rule of Three, when we have a sample size n with x=0 successes, we have 95%…
A: Given 95% confidence interval Upper bound=3/n
Q: QUESTION 22 A group of 64 randomly selected students, from all MTH213 sections at Zayed University,…
A: Given n=sample size=64, sample mean x̄=74, sample standard deviations s=4 Level of significance…
Q: an average of 3kg in a month. In a book, the authors claim that people who follow a new diet will…
A: Given : Population mean =3 Sample mean =2.7 Standard deviation =2.8 n=180 Note :As per guidelines…
Q: The distribution of course grades in a very large class is (approximately) Normal with mean 48 and…
A: Given information: The distribution of course grades in a very large class is Normal with mean 48…
Q: The following data represent the pH of rain for a random sample of 12 rain dates. A normal…
A: Given: n = 12 Confidence level = 99% Formula Used: Confidence Interval = X ± t*sn
Q: Stem-and-Leaf Display N = * Leaf Unit = 0.1 9 0 002334666 20 1 01123356777 (**) 2 00122223346799 ***…
A:
Q: A simple random sample of size n is drawn from a population that is normally distributed. The sample…
A:
Q: Ashley's Internet service is terribly unreliable. In fact, on any given day, there is a 30 % chance…
A:
Q: In a study conducted in Italy, 10 patients with hypertriglyceridemia were placed on a low-fat,…
A: Given that, 10 patients with hypertriglyceridemia were placed on a low-fat, high-carbohydrate diet.…
Q: Clue is a board game in which you must deduce three details surrounding a murder. In the original…
A:
Q: i. Calculate the mean ii. Calculate the median iii. Calculate the mode iv. Comment on the…
A:
Q: The mean and variance of a binomial variate are 4 and - 3 find P[X ≥ 1]. respectively,
A: Given,mean(μ)=4variance(σ2)=43
Q: Out of 479 applicants for a job, 121 have over 10 years of experience and 62 have over 10 years of…
A: From the provided information, Total applicants = 479 121 have over 10 years of experience and 62…
Q: QUESTION 22 A group of 64 randomly selected students, from all MTH213 sections at Zayed University,…
A: Given Standard deviations=4 Sample size=64 Sample mean=74 Alpha=0.01
Q: The mean and variance of a binomial variate are 4 and find ly 11 ا دیا 3 respectively,
A: Let X be a Binomial random variable with parameters n and p. EX=npVX=np1-p Given that mean and…
Q: If X is uniformly distributed with mean 1 and variance 4/3 find P(X<0)
A:
Q: (f) Interpret the slope. Select the correct choice below and, if necessary, fill in the answer box…
A: Slope is average change in response variable for every unit change explanatory variable.
Q: QUESTION 22 A group of 64 randomly selected students, from all MTH213 sections at Zayed University,…
A: Solution : We have given that, Sample Size, n = 64 Sample Mean, x̄ = 74…
Q: MULTIPLE CHOICE QUESTION The SLR of Weight=1+0.5*Height estimate the Weight for Height=180 91 90…
A: Weight=1+0.5×Height Given Height=180
Q: 2. Tesla Motors claims that its Model S electric car can travel more than 300 miles at 55 mph when…
A: Givenclaim is that its Model S electric car travel more than 300 miles
Q: A normal distribution of BMCC MAT51 scores has a standard deviation of 1.6. Find the z-scores…
A: Given,standard deviation(σ)=1.6
Q: The claim is that weights (grams) of quarters made after 1964 have a mean equal to 5.670 g as…
A: Hello! As you have posted more than 3 sub parts, we are answering the first 3 sub-parts. In case…
Q: If X is Uniformly distributed in ДЛ 2 .Find the p.d.f of Y=tan X.
A:
Q: Problem: Do colors affect mood? You are particularly interested to know which color gives people a…
A: Solution: Given information: k= 5 Groups or treatment
Q: ANOVA Regression Residual Total tercept mber of lespersons df Coefficients 77.0 43.0 SS 6,847.3…
A: Given, ntotal=38
Q: The accompanying data represent the number of days absent, x, and the final exam score, y, for a…
A: The independent variable is No. of absences. The dependent variable is Final exam score. No. of…
Q: a. What is the equation of the regression line for all 10 points? ŷ=+x (Round to three decimal…
A: First we have to obtain the pair of value of 10 points. The values are (x,y) is ,…
Q: There are 24 different colored pencils in a box. What is the probability that the orange pencil and…
A: In the given situation, There are 24 different colored pencils in a box. Here, orange and green…
Q: The average height of students at a random place from an SRS of 12 students gave a standard…
A: The sample size is 12 and sample standard deviation is 2.5.

Step by step
Solved in 3 steps

- Find the regression equation, letting the diameter be the predictor (x) variable. Find the best predicted circumference of a beachball with a diameter of 44.4 cm. How does the result compare to the actual circumference of 139.5 cm? Use a significance level of 0.05. Baseball Basketball Golf Soccer Tennis Ping-Pong Volleyball Diameter 7.3 23.8 4.2 22.3 7.1 4.0 21.2 Circumference 22.9 74.8 13.2 70.1 22.3 12.6 66.6 LOADING... Click the icon to view the critical values of the Pearson correlation coefficient r.Find the regression equation, letting overhead width be the predictor (x) variable. Find the best predicted weight of a seal if the overhead width measured from a photograph is 2.3 cm. Can the prediction be correct? What is wrong with predicting the weight in this case? Use a significance level of 0.05. Overhead Width (cm) 7.2 8.3 8.8 8.1 9.9 9.8 Weight (kg) 121 195 210 156 250 253Find the regression equation, letting overhead width be the predictor (x) variable. Find the best predicted weight of a seal if the overhead width measured from a photograph is 2cm. Can the prediction be correct? What is wrong with predicting the weight in this case? Use a significance level of 0.05.
- Draw a scatter diagram for the above data Obtain the regression equation by using least square method Predict the price of a house with a size of 28 square feetWhat is the regression equation? Find the best predicted weight of a bear with the chest size of 53 inches. Listed below are the overhead widths (cm) of seals measured from photographs and weights (kg) of the seals. Find the regression equation, letting the overhead width be the predictor (x) variable. Find the best predicted weight of a seal if the overhead width measured from a photograph is 1.8cm, using the regression equation. Can the prediction be correct? If not, what is wrong? Use a significance level of 0.05. Overhead Width (cm) 7.1 7.3 9.9 9.3 8.8 8.3 Weight (kg) 137 176 282 230 230 214 The regression equation is y=+x. (Round the constant to the nearest integers needed. Round the coefficient to one decimal place as needed.) The best-predicted weight for an overhead width of 1.8 cm, based on the regression equation, is: ____ kg. (Round to one decimal place as needed.) Can the prediction be correct? If not, what is wrong? A. The prediction cannot be correct because a weight of zero does not…
- For the regression with Percent Water causing International Migration per 1000, is the result statistically significant? How do you know? A It is impossible to tell without knowing the confidence level. B The coefficient is high C The p value is low D The coefficient is low E The p value is higha. The regression equation is? b.The best-predicted weight for an overhead width of 2.2 cm is?Is the price of a smartphone affected by its display size, camera resolution, or internal storage capacity? Perform a regression analysis on the SmartphoneDCS dataset and answer the following questions. The level of significance is .05. Solve this problem using MegaStat, and write your complete answers in the Response Box so I know that you can interpret the output. Attach your MegaStat file so I can see that you used the correct analysis method to solve this problem. Download: SmartphoneDCS a. Do the data conform to Evans' Rule? What about Doane's Rule? Show the calculations to explain the reason for your answers. b. State the decision rule for this analysis, and be sure to include the critical value(s). c. Perform the regression and write the complete regression equation. d. Is the overall fit of the model significant or not? Use the output from the ANOVA table and your answer to part (b) to explain your decision. e. What are the values for the coefficient of determination and…
- It has been concluded that the tip value has a relationship with the bill of the dinner. Given the table, conduct regression analysis. Answer AFind the regression equation, letting overhead width be the predictor (x) variable. Find the best predicted weight of a seal if the overhead width measured from a photograph is 2.1cm. Can the prediction be correct? What is wrong with predicting the weight in this case? Use a significance level of 0.05. The regression equation is y^=_____+_____x. overhead width (cm) 8.2 7.4 9.6 7.9 7.6 8.7 weight (kg) 159 156 241 144 154 207 n α=0.05 α = 0.01 4 0.950 0.990 5 0.878 0.959 6 0.811 0.917 7 0.754 0.875 8 0.707 0.834 9 0.666 0.798 10 0.632 0.765 11 0.602 0.735 12 0.576 0.708 13 0.553 0.684 14 0.532 0.661 15 0.514 0.641 16 0.497 0.623 17 0.482 0.606 18 0.468 0.590 19 0.456 0.575 20 0.444 0.561 25 0.396 0.505 30 0.361 0.463 35 0.335 0.430 40 0.312 0.402 45 0.294 0.378 50 0.279 0.361 60 0.254 0.330 70 0.236 0.305 80 0.220 0.286 90 0.207 0.269 100 0.196 0.256 n α = 0.05 α = 0.01Using your favorite statistics software package, you generate a scatter plot with a regression equation and correlation coefficient. The regression equation is reported as y=−66.75x+57.0 and the r=−0.504. Report answer as a percentage accurate to one decimal place.