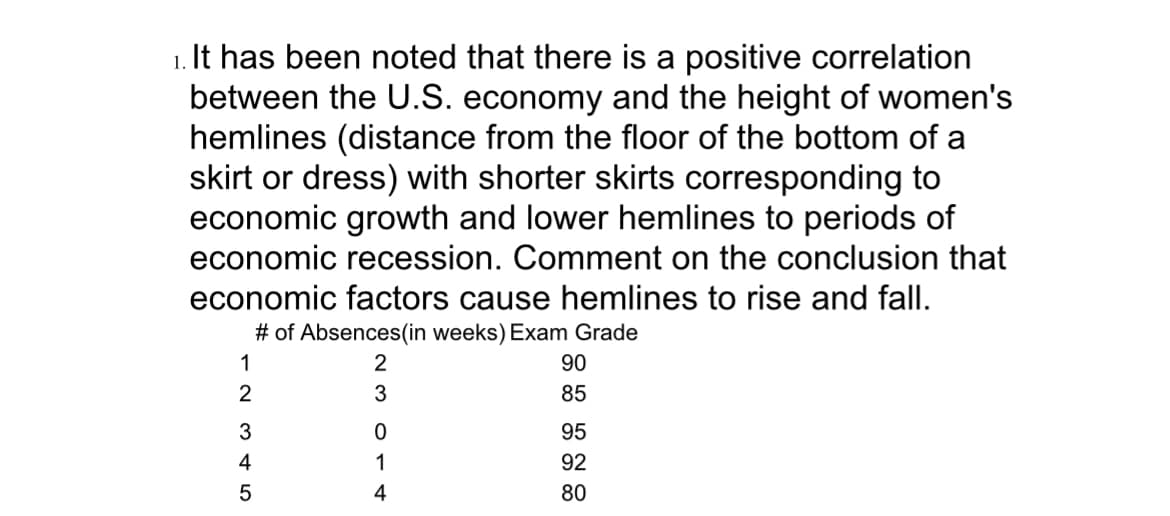
1. It has been noted that there is a positive correlation between the U.S. economy and the height of women's hemlines (distance from the floor of the bottom of a skirt or dress) with shorter skirts corresponding to economic growth and lower hemlines to periods of economic recession. Comment on the conclusion that economic factors cause hemlines to rise and fall. # of Absences (in weeks) Exam Grade 1 2 3 4 5 2 3 0 1 4 90 85 95 92 80
Q: According to a survey, the probability that a randomly selected worker primarily drives a car to…
A: given data P( drives a car) = 0.757P(use public transport) = 0.083
Q: Earlier this semester, we learned to use 2-Sample-TTest to compare the population means of two…
A: Solution: From the given information,
Q: Bo is buying some nails for a project. They are interested in whether the boxes are significantly…
A: Solution: Given information: n=8 Sample size x= 9.8 Sample mean s=0.4 Sample standard deviation…
Q: The average height of students at a random place from an SRS of 12 students gave a standard…
A: The sample size is 12 and sample standard deviation is 2.5.
Q: TEX If X is uniformly distributed in (-1,1).Find the p.d.f of y = sin 2 .
A:
Q: ADVERTISING VS SALES (Exercise 2) A study was made by a retail merchant to determine the relation…
A: The question is about correlation and regression Given : To find : A ) Plot scatter diagram B )…
Q: If X is uniformly distributed with mean 1 and variance 4/3 find P(X<0)
A: GivenA random variable x~Uniform distributionMean=1variance=43
Q: A data set about speed dating includes "like" ratings of male dates made by the female dates. The…
A: Given: n=186 X=5.82s=2.15μ=6.00α=0.05
Q: Draw rough box plots for the following two figures separated by a black bar 4 BI U A A XX₂E 12pt…
A: The first histogram is roughly normal and there are no outliers in histogram (i). So while creating…
Q: interest is to estimate the mean age of students at the time they take the comprehensive exam for…
A: Given margin of errors (m.e)=1.5 standard deviation (sigma)=3.3 confidence interval=98% =0.98 level…
Q: nsider the standard normal random variable Z to compute each expression. (a) P(−1.65≤Z≤0.28)…
A: given data ,standard normal random variable Z X~N(0,1) we have to find out the given probabilities
Q: Where does the 59 come from? Can you show the formula?
A: There is not 59. there should be 56 because from given data we have : μ=56 [not a 59]σ=4.7
Q: Solid fats are more likely to raise blood cholesterol levels than liquid fats. Suppose a…
A:
Q: It is known that 5% of the books bound at a certain bindery have defective bindings. Find the…
A:
Q: Claim: A majority of adults would erase all of their personal information online if they could. A…
A: given data Claim: A majority of adults would erase all of their personal information online if they…
Q: The accompanying data are drive-through service times (seconds) recorded at a fast food restaurant…
A: Given that: Service Times (in minutes) 295 150 140 165 161 267 281 169 142…
Q: If X has a exponential distribution with parameter 2,find the p.d.f of Y=log X.
A:
Q: A discrete RV X has M.G.F Mx(t) e2(et -1). Find E (X), var (X) and P(X=0)
A:
Q: QUESTION 22 A group of 64 randomly selected students, from all MTH213 sections at Zayed University,…
A: Given n=sample size=64, sample mean x̄=74, sample standard deviations s=4 Level of significance…
Q: !!!! MULTIPLE CHOICE QUESTION consider Y=2+3*X if X increases by 2 units, Y would increase by: 8…
A: Y=2+3×X
Q: The following problem deals with evaluating a particular expression from Topic 17 a Say you get a…
A: Given that ; the z-score = -1.21
Q: In a experiment on relaxation techniques, subject's brain signals were measured before and after the…
A: Given: n = 5 α = 0.05 Formula Used: Test-statistic t = d-μdsdn
Q: An investigation was conducted into the dust content in the flue gases of two types of solid-fuel…
A: Since there are multiple sub-parts, as per the honor code the first three sub-parts will be solved.…
Q: an average of 3kg in a month. In a book, the authors claim that people who follow a new diet will…
A: Given : Population mean =3 Sample mean =2.7 Standard deviation =2.8 n=180 Note :As per guidelines…
Q: Should you generate electricity with your own personal wind turbine? That depends on whether you…
A: (b) Obtain the 95% confidence interval for the true population mean. The 95% confidence interval for…
Q: Consider a hypothetical regression predicting if someone will be married or not by the age of 40,…
A: Given that, the regression model is MARRIED = 0.2 + 0.03*EDUCATION - 0.01*BMI
Q: What is the probability that a randomly selected package of grapes weighs more than a randomly…
A:
Q: The following table gives the thousands of workers in a country who were union members for selected…
A:
Q: Guidance Missile System A missile guidance system has eight fail-safe components. The probability of…
A: From the provided information, Sample size (n) = 8 Probability of each failing is 0.05 that is p =…
Q: Consider a Qunat vars X and Y and suppose we have collected data on both of them from an underlying…
A: We check the association between dependent and independent variable using coefficient of…
Q: Carry your intermediate computations to at least three decimal places. (If necessary, consult a list…
A: Followings are the Explanation of the question Use the Two sample independent t test Given that,…
Q: - A die is thrown 3 times. If getting a 6 is nsidered as success find the probability o
A: Single Die has 6 outcomes: {1, 2, 3, 4, 5, 6}. P(success)=P(getting 6)=1/6. A die is thrown 3 times.…
Q: US the nomat cur helpful to draw a n The useful life of a c standard deviation 26. What percentag…
A: Hey, since there are multiple questions posted, we will answer first three question. If you want any…
Q: ..If X is a Normal variate with mean30 and D 5.Find P [26<X<40].
A: Given that mean =30 standard deviation=5
Q: It is known that 5% of the books bound at a certain bindery have defective bindings. Find the…
A: Givenp=0.05sample size(n)=100Let "x" be no.of books bound by this bindery will have defective…
Q: A volume of sediment is being measured in a geological survey. The depth of the sediment is measured…
A:
Q: 7.If X is a continuous RV whose PDF is given by Find c.and mean of X. fc(4x-2x²), 0<x<2 f(x)= 10,…
A:
Q: Suppose that 10% of the fields in a given agricultural area are infested with the sweet potato…
A: From given data we have : n=100 x=40 Sample Prop. p^=xn=40100=0.4
Q: If the probability that a target is destroyed on any one shot is 0.5, what is the probability that…
A: Given: The probability that a target is destroyed is p = 0.5 The probability that a target is not…
Q: A RV X has a uniform distribution over (-4, 4) compute P(|X|>2)
A:
Q: 4 When the prevalence of a disease in the population is very low, such as HIV infection or certain…
A: Given information: Test Positive Test negative Total Have HIV 1339370 4030 1343400 Do not…
Q: A simple random sample of size n is drawn from a population that is normally distributed. The sample…
A:
Q: e) What is the expected value of X - 3? f) What is the expected value of 6X? g) What is the…
A: by bartleby policy i can gives only 3 subparts at a time here first we have to find expected value…
Q: Food Availability 7. Circle the correct answer. Would you expect the p value to be: p> 0.05 p<0.05…
A: An error bar graph depicts how the food availability compares to the number of offspring. To check…
Q: The weight of 45 watermelons from a farm is shown below. Weight Frequency 11-15 4 16-20 8 21-25…
A: Given data is Weight Frequency 11 - 15 4 16 - 20 8 21 - 25 13 26 - 30 11 31 - 35 9
Q: Suppose a simple random sample of size n=44 is obtained from a population with µ-61 and o=16 (a)…
A: given data n = 44μ= 61σ = 16
Q: 28. The heights of boys in a grade 10 class are normally distributed with a mean of 168 cm and a…
A: Given: Mean(μ)=168cm standard deviation(σ)=2.5cm
Q: 2. CREATININE LEVEL PROBLEM To compare the performance of the two machines a technician took eight…
A: Given Information: Consider the given output:
Q: The following data represent the pH of rain for a random sample of 12 rain dates. A normal…
A: Given: n = 12 Confidence level = 99% Formula Used: Confidence Interval = X ± t*sn
Q: Find the critical value(s). Round the answer to at least three decimal places. If there is more than…
A: Given: n = 6 α = 0.10 Formula Used: Test-statistic t = d-μdsdn
Step by step
Solved in 2 steps
- 9) The following results are from a regression where the dependent variable is GRADUATION RATE and the independent variables are % OF CLASSES UNDER 20, % OF CLASSES OF 50 OR MORE, STUDENT/FACULTY RATIO, ACCEPTANCE RATE, 1ST YEAR STUDENTS IN TOP 10% OF HS CLASS. The data were split into 2 samples and the following regression results were obtained from the split data. c) Based on a comparison of the two sets of output, does it appear that there is heteroscedasticity in the data set? Explain. Be sure to write down your null and alternative hypothesis, calculate the test statistic, and find your critical value (test at the 5% level of significance).Suppose a researcher believes that the occurrence of natural disasters such as earthquakes leads to increased activity in the construction industry. he decides to collect province-level data on employment in the construction industry of an earthquake-prone country, like Japan, and regress this variable on an indicator variable that equals 1 if an earthquake took place in that province in the last five years. a. Should the researcher include province fixed effects in order to control for location specific characteristics of the labor market? b. What can the researcher to control for the location effects?2. A scatterplot shows a strong, positive, linear relationship between the number of rebounds a basketball team averages and the number of wins that team records in a season. Which conclusion is most appropriate? (A) A team that increases its number of rebounds causes its chances of winning more games to increase. (B) If the residual plot shows no pattern, then it is safe to conclude that getting more rebounds causes more wins, on average. (C) If the residual plot shows no pattern, then it is safe to conclude that getting more wins causes more rebounds, on average. (D) If the r^2r2 value is close enough to 100%, then it is safe to conclude that getting more rebounds causes more wins, on average. (E) Rebounds and wins are positively correlated, but we cannot conclude that getting more rebounds causes more wins, on average.
- Recent publications have addressed the growing concern in the scientific community around the increased prevalence of CAT scans in children between the ages of 7-18 and the growing rate of childhood cancers. Suppose the researcher plans to gather a SRS from a group of children in this age range who have received one or more CAT scans, and a SRS from a group of children who have never received a CAT scan and compare the number of cases of childhood cancers that develop over a prolonged period of time. Assume the following table summarizes the descriptive statistics for his samples. Population Average cases of childhood cancers Standard deviaton Sample size >CAT scan 24.6 2.4 1,894 No CAT scans 11.4 1.9 2,745 A) Carry out the appropriate statistical test to answer the researcher’s hypothesis regarding the difference in average cases of childhood cancers in children aged 7-18 receiving one or more CAT scans versus those that have never received a CAT scan. Use an alpha level…9) The following results are from a regression where the dependent variable is GRADUATION RATE and the independent variables are % OF CLASSES UNDER 20, % OF CLASSES OF 50 OR MORE, STUDENT/FACULTY RATIO, ACCEPTANCE RATE, 1ST YEAR STUDENTS IN TOP 10% OF HS CLASS. The data were split into 2 samples and the following regression results were obtained from the split data. a) What is heteroscedasticity? (b) Why is heteroscedasticity a problem? c) Based on a comparison of the two sets of output, does it appear that there is heteroscedasticity in the data set? Explain. Be sure to write down your null and alternative hypothesis, calculate the test statistic, and find your critical value (test at the 5% level of significance).TRUE or False 1)Logistic regression cannot be employed when the dependent variable is binary. 2)In the average linkage clustering, the distance between two clusters is defined as the average of distances between all pairs of objects, where each pair is made up of one object from each group. 3)As Monte Carlo simulation is essentially statistical sampling, the larger the number of trials used, the more precise is the result. 4)Monte Carlo simulation is an inappropriate tool to analyze cash budgets because of the inherent uncertainty of the sales forecasts on which most cash budgets are based 5)Any solution that satisfies all constraints of a problem is called a feasible solution..
- Engro group, who recently sold its Engro foods start-up for a multi-million-rupees sum, islooking for another investment for fresh capital. It is considering an investment in coal (X) andsolar (Y) power plant. For that they had a collected data on 5 different characteristics. Amandahas applied k-means clustering to this data for k = 2. Given the following data:Table 5.1 Observations X Y 1 20 18 2 8 20 3 36 26 4 22 12 5 14 4 a) Which value of k is the most appropriate to categorize these investments? Justify yourchoice with calculations.b) The two cluster centers after the first round of execution. c) The final two clusters. d) Visually represent the clusters of both parts (b) and (c).Engro group, who recently sold its Engro foods start-up for a multi-million-rupees sum, is looking for another investment for fresh capital. It is considering an investment in coal (X) and solar (Y) power plant. For that they had a collected data on 5 different characteristics. Amanda has applied k-means clustering to this data for k = 2. Given the following data: Table 5.1 Observations X Y 1 20 18 2 8 20 3 36 26 4 22 12 5 14 4 Visually represent the clusters of both parts2.5 interpret the correlation coefficient calculate in question 2.4 above 2.6 Predict the number of policies written annually by an agent with 3 years of experience
- 4) the accompanying dataset provides data on monthly unemployment rates for a certain region over four years. Compare 3- and 12- month moving average forecast using the MAD criterion. Which of the two models yields better results? (See picture) Find the MAD for the 3 month moving average forcast. MAD = _____please answer 1 & 2 The National Highway Safety Administration recognizes that the antilock braking system as a revolutionary safety feature. The claim is that automobiles with this system are involved in fewer fatal crashes than those without. State the null and the alternative hypothesis to test this claim. An economist believes that there is a positive correlation between income and percent of disposable income saved by young adults. To test this, a sample of income and saving data is gathered from the Division of Taxation for adults under the age of 35. State the null and the alternative hypothesis to test this claim.Mr. William Profit is studying companies going public for the first time. He is particularly interested in the relationship between the size of the offering and the price per share. A sample of 15 companies that recently went public revealed the following information. Size Price Size Price ($ millions), per Share, ($ millions), per Share, Company x y Company x y 1 9.0 10.8 9 160.7 11.3 2 94.4 11.3 10 96.5 10.6 3 27.3 11.2 11 83.0 10.5 4 179.2 11.1 12 23.5 10.3 5 71.9 11.1 13 58.7 10.7 6 97.9 11.2 14 93.8 11.0 7 93.5 11.0 15 34.4 10.8 8 70.0 10.7 Click here for the Excel Data File a. Determine the regression equation. (Round your answers to 4 decimal places.) b-1. State the decision rule for 0.05 significance level: H0: β ≤ 0; H1: β > 0. (Round your answer to 3 decimal places.) b-2. Compute the value of the test statistic. (Round your…