The responses of 1371 voters to a survey about the way the media conducted themselves in a recent political campaign are shown in the accompanying Pareto chart. Find the probability of each event listed in parts (a) through (d) below. Click the icon to view the Pareto chart.
The responses of 1371 voters to a survey about the way the media conducted themselves in a recent political campaign are shown in the accompanying Pareto chart. Find the probability of each event listed in parts (a) through (d) below. Click the icon to view the Pareto chart.

Chapter8: Sequences, Series,and Probability
Section8.7: Probability
Problem 4ECP: Show that the probability of drawing a club at random from a standard deck of 52 playing cards is...

Related questions
Question
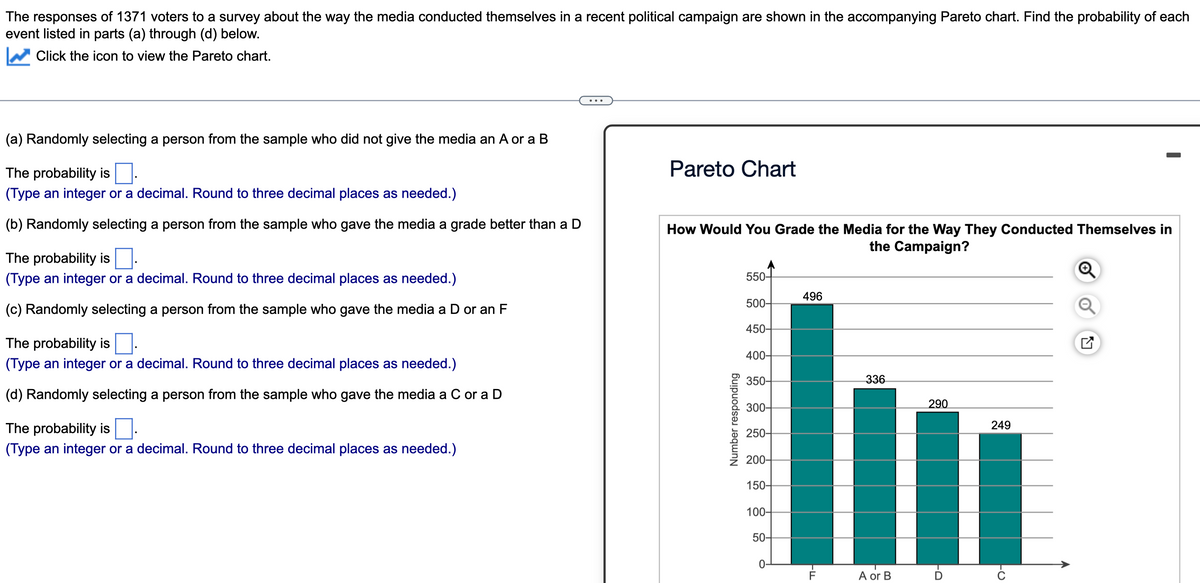
Transcribed Image Text:The responses of 1371 voters to a survey about the way the media conducted themselves in a recent political campaign are shown in the accompanying Pareto chart. Find the probability of each
event listed in parts (a) through (d) below.
Click the icon to view the Pareto chart.
(a) Randomly selecting a person from the sample who did not give the media an A or a B
The probability is.
(Туре integer or decimal. Round to three decimal places as needed.)
(b) Randomly selecting a person from the sample who gave the media a grade better than a D
The probability is
(Type an integer or a decimal. Round to three decimal places as needed.)
(c) Randomly selecting a person from the sample who gave the media a D or an F
The probability is.
(Type an integer or a decimal. Round to three decimal places as needed.)
(d) Randomly selecting a person from the sample who gave the media a C or a D
The probability is
(Type an integer or a decimal. Round to three decimal places as needed.)
Pareto Chart
How Would You Grade the Media for the Way They Conducted Themselves in
the Campaign?
Number responding
550-
500-
450-
400-
350-
300-
250-
200-
150-
100-
50-
O
496
-ד
F
336
A or B
290
FO
I
249
Expert Solution
This question has been solved!
Explore an expertly crafted, step-by-step solution for a thorough understanding of key concepts.

This is a popular solution!

Trending now
This is a popular solution!

Step by step
Solved in 4 steps

Recommended textbooks for you

Holt Mcdougal Larson Pre-algebra: Student Edition…
Algebra
ISBN:
9780547587776
Author:
HOLT MCDOUGAL
Publisher:
HOLT MCDOUGAL

College Algebra (MindTap Course List)
Algebra
ISBN:
9781305652231
Author:
R. David Gustafson, Jeff Hughes
Publisher:
Cengage Learning
Holt Mcdougal Larson Pre-algebra: Student Edition…
Algebra
ISBN:
9780547587776
Author:
HOLT MCDOUGAL
Publisher:
HOLT MCDOUGAL
College Algebra (MindTap Course List)
Algebra
ISBN:
9781305652231
Author:
R. David Gustafson, Jeff Hughes
Publisher:
Cengage Learning