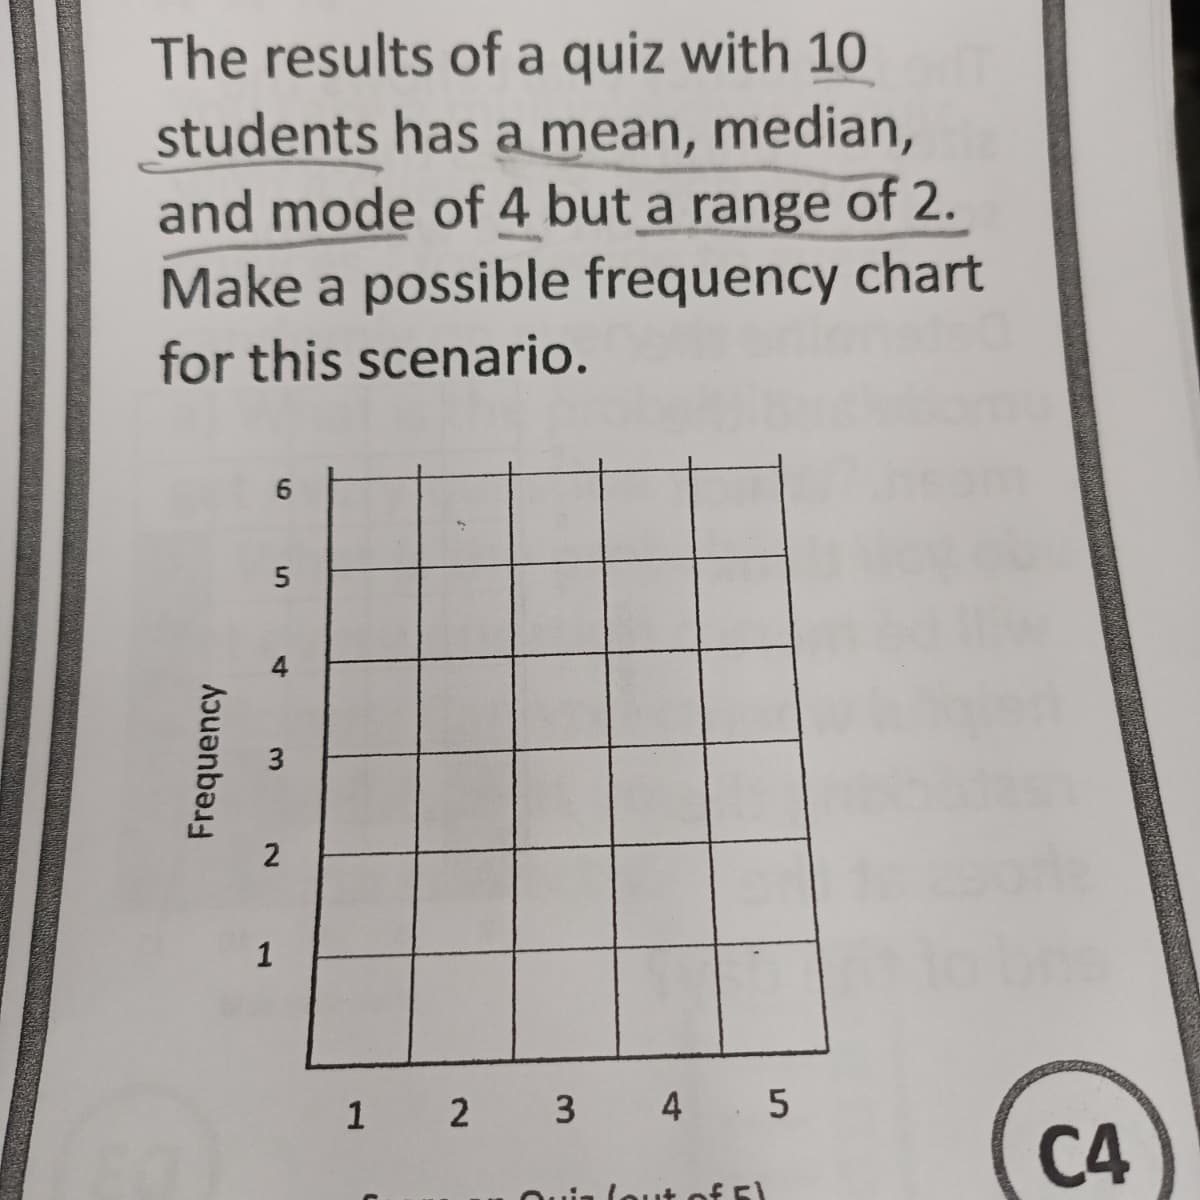
The results of a quiz with 10 students has a mean, median, and mode of 4 but a range of 2. Make a possible frequency chart for this scenario. Frequency 6 5 m 2 1
Q: In a study of the accuracy of fast food drive-through orders, one restaurant had 36 orders that were…
A: Given n=318 X=36
Q: Use the given statistics to complete parts (a) and (b). Assume that the populations are normally…
A:
Q: R can be used to find the probability of obtaining a given F value or one more extreme (calculates…
A: The question is about ANOVA Given : Total no. of groups ( k ) = 2 No. of subjects in each group = 10…
Q: 0.10 Complete the following. (If necessary, consult a list of formulas.) (a) Find the expectation E…
A: It is given that the random variable X with probability distribution function.
Q: was done using a treatment group and a placebo group. The results are shown in the table. Assume…
A: Given n1=28 n2=36 Xbar1=2.35 Xbar 2=2.64
Q: the three median y-values that would form the summary poin - the dataset in the table. =y 15 16 16…
A: Given dividing above data into 3 segments of 3,4,3 values Y values 1st Segment=15,16,16 2nd…
Q: # 32
A: It is given that The equation which has the form E(y) = y^ = b0 + b1x1 + . . . + bpxp.
Q: Show that the conditional variance can be written as σ^2 (X) = E { Y^2 | X} −(E[Y | X])^2 no…
A: A variance is a measurement of how far each individual in the dataset is residing from the mean and…
Q: A study was conducted to determine the proportion of people who dream in black and white instead of…
A: The question is about hypo. testing Given : Total no. of people over the age of 55 ( n1 ) = 321 No.…
Q: PROBLEM: Suppose that a timer for a video game has a randomly determined length of time, after which…
A: Since you have asked multiple question, according to our guidelines we will solve the first question…
Q: Because variance divided by the sample size gives you the estimated standard error, as the sample…
A: Given that, the estimated standard error is the variance divided by the sample size.
Q: A number cube with faces labeled I to 6 Is The number rolled will be recorded as the outcome.…
A: And: And is defined as the outcomes which occurs in one event that also occur in another event. Or:…
Q: ANOVA df Total SS Regression 2 121.0625 60.5312 50.1910 Residual 9 10.8542 1.2060 11 131.9167 MS…
A: Solution: Given information: n= 12 observation k= 1 independent variables
Q: (a) Write the regression equation. ŷ= -11.320 +0.788x₁ +0.151x2 ✓ (b) Interpret the coefficients of…
A: Given that, Dependent variable (y) = Sales Independent variables: x1 = Advertising expenditures x2 =…
Q: According to Time Magazine (June 11, 2012), 33% of all cars sold in the United States are SUV'S.…
A: The question is about hypo. testing Given : Popl. prop. of all cars sold are "S" ( p ) = 0.33…
Q: The average production cost for major movies is 58 million dollars and the standard deviation is 20…
A: Note- Since you have posted a question with multiple sub-parts, we will solve the first three…
Q: 9.1 Q6 Need test statistic, p value, claim, & interval.
A: Given Sample 1 is the sample of occupants not wearing seat belts. Sample 2 is the sample of…
Q: ancy is a waitress at Seventh Heaven Hamburgers. She wants to estimate the average amount each table…
A: given data n=5data score are, 12,8,7,5,8CI=0.90α=1-0.90=0.10first we find out the mean and standard…
Q: Let X have a binomial distribution with parameters n=25 and p. Calculate each of the following…
A: Given information: X follows the Binomial distribution n = 25 and p.
Q: The average baptismal ceremony includes 50 guests with a standard deviation of 10. A random sample…
A: The claim is that average number of guests differs from the national average. That is µ ≠ 50. The…
Q: a.) Construct the scatter diagram. b.) Compute and interpret the sample correlation coefficient. c.)…
A: Use the Excel and draw the Scatterplot Followings are the Steps to draw the Scatterplot 1) Open the…
Q: Let X₁, X2, X3,..., Xn denote a random sample of size n from the population distributed with the…
A: Given that X1, X2, X3, . . ., Xn denote a random sample of size n from the population with the…
Q: 3. A botanist wants to know if the growth of plants is affected by music. He does this by subjecting…
A:
Q: The company that manufactures car engine spark plugs has stated in its test that the durability of…
A: A continuous random variable X is said to follow Normal distribution with parameters μ and σ2 if its…
Q: The Mathematics Department in a certain university is conducting a study to determine how long it…
A: Solution: Given information: n= 26 Sample size x= 3.5 Sample mean s= 1.5 Sample standard deviation…
Q: Question 3: For the following politically incorrect data from Quinlan: Height Hair Small Tall Tall…
A: Height Hair Eyes Attractive small Blonde Brown No Tall Dark Brown No Tall Blonde Blue Yes…
Q: Regression and correlation analysis both describe the strength of linear relationships between…
A: Information can be direct or curvilinear. Curvilinear fashion is that fashion when two variables are…
Q: You received a large batch of LEDs with dominant wavelength uniformly distributed between 622.5nm…
A: Given that a large batch of LEDs with dominant wavelength uniformly distributed between 622.5nm and…
Q: What is the equation of the median-median line for the dataset in the table? I Y 2 6 12 107 C 8 22…
A: Given n=10
Q: K very painful "cluster" headaches, 158 patients were treated with oxygen and 142 other patients…
A:
Q: 28 Actress (years) 30 30 Actor (years) 63 41 39 The ages are matched according to the year that the…
A:
Q: 1. The weights of 9-ounce bags of a particular brand of potato chips can be modeled by a normal…
A: As per our guidelines we are supposed to answer only one question per post so i am solving first…
Q: A population of values has a normal distribution with μ = n = 18 is selected, 205.9 and o= 26. If a…
A:
Q: 18. Overweight According to the Centers for Disease Control and Prevention, 19.6% of children aged 6…
A: Given info: According to the Centers for Disease Control and Prevention, 19.6% of children aged 6 to…
Q: Instructions: Show & Explain well your work and calculations. With U = (10, 20, 30, 40, 50, 60, 70,…
A: Basic concepts of probability are used
Q: The table below summarizes data from a survey of a sample of women. Using a 0.05 significance level,…
A:
Q: a) In a random sample of 20 second year statistics students from a normal distribution, N (μ,0²)…
A: The following information has been provided: The sample size is n=20. ∑i=120Xi=30∑i=120Xi2=60
Q: Conduct the hypothesis test and provide the test statistic and the critical value, and state the…
A: Solution: Given information: n=200 Sample size k= 6 categories
Q: Prof. Watson wants to predict children’s aggressive scores based on the participants’ gender and…
A: Given information: Prof. Watson wants to predict children’s aggressive scores based on the…
Q: If a binomial distribution satisfies the criterion for using the normal approximation with p = 0.15,…
A:
Q: Suppose that a researcher is interested in estimating the mean systolic blood pressure, μ, of…
A: Given:
Q: It has been observed that some persons who suffer renal failure, again suffer renal failure within…
A: The information provided in the question are as follows : Let p1 represents the population 1 and p2…
Q: There is sufficient evidence to warrant rejection of the claim that the first population proportion…
A:
Q: or the dataset in the table. x y 1 15 2 16 3 16 5 18 8 18 9 16 12 27 15 29 18 20 20 33 O x₁=2,…
A: Given dividing above data into 3 segments of 3,4,3 values X dada set 1st Segment=(1,2,3) 2nd…
Q: According to an article in Bloomberg Businessweek, New York City's most recent adult smoking rate is…
A:
Q: Use the Table of Descriptive statistics, correlation (r), the standard error of the correlation…
A: From the computation r = 0.724224 zr=0.5ln1+r1-r=0.5 ln1.72420.2758=0.9164 SEzr =1n-3=112-3=0.33 The…
Q: explain Regression analysis and its limations
A: Regression analysis : Regression analisis is a power statstical method is identifying the…
Q: write FALSE. 1. If a 90% confidence interval estimate for the population mean score of all Stat 101…
A: It is given that the 90% confidence interval estimate for population mean score is (38, 42).
Q: Determine the given material's degree of explanation. Material: x 2 3 5 y 10 16 22 Please do not…
A: The measure of association between two variables is calculated using the correlation coefficient. It…
Q: Conditional probability distribution X given that Y = 1 f(x, y) 1/4 1/2 1/8 1/8 fxx (x) -1.0 -0.5…
A: x y f(x,y) -1 -2 1/4 -0.5 -1 1/2 0.5 1 1/8 1 2 1/8
Step by step
Solved in 2 steps with 2 images