The results of an online regional survey of the approval rating of the President before and after pandemic is given below. Test if there is a statistical proof, assuming equal variance and 5% level of significance, that there is a difference between their rating in relation to the pandemic experienced by the country. Assuming normality of data is observed.
The results of an online regional survey of the approval rating of the President before and after pandemic is given below. Test if there is a statistical proof, assuming equal variance and 5% level of significance, that there is a difference between their rating in relation to the pandemic experienced by the country. Assuming normality of data is observed.

Algebra & Trigonometry with Analytic Geometry
13th Edition
ISBN:9781133382119
Author:Swokowski
Publisher:Swokowski
Chapter10: Sequences, Series, And Probability
Section10.2: Arithmetic Sequences
Problem 68E

Related questions
Question
The results of an online regional survey of the approval rating of the President before and after pandemic is given below. Test if there is a statistical proof, assuming equal variance and 5% level of significance, that there is a difference between their rating in relation to the pandemic experienced by the country. Assuming normality of data is observed.
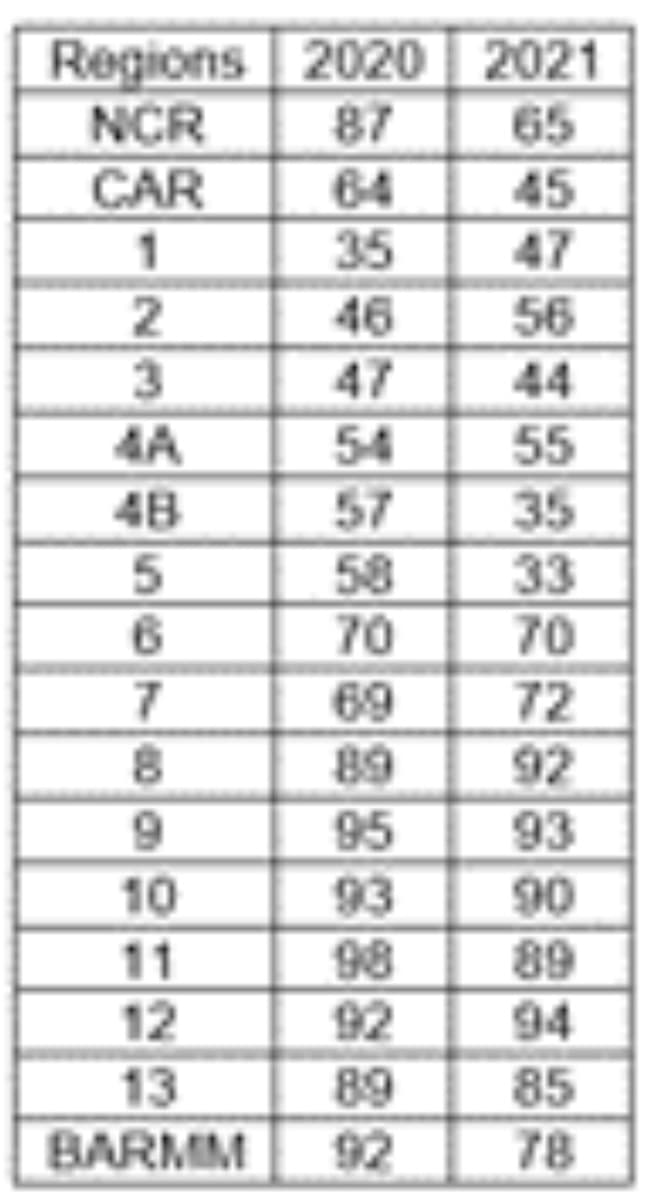
Transcribed Image Text:Regions 2020
65
45
47
2021
NCR
87
64
35
CAR
56
46
47
3
44
55
35
4A
54
48
57
58
70
33
70
6.
69
89
72
92
93
90
95
93
98
92
10
89
94
11
12
89
92
13
85
78
BARMM
Expert Solution
This question has been solved!
Explore an expertly crafted, step-by-step solution for a thorough understanding of key concepts.

Step by step
Solved in 3 steps

Recommended textbooks for you
Algebra & Trigonometry with Analytic Geometry
Algebra
ISBN:
9781133382119
Author:
Swokowski
Publisher:
Cengage
Algebra & Trigonometry with Analytic Geometry
Algebra
ISBN:
9781133382119
Author:
Swokowski
Publisher:
Cengage