The retirement ages of a group of steel workers are recorded below. Construct a histogram with 4 classes using Microsoft Excel, Google Sheets, or GeoGebra. You will upload the graph in the next question. {64, 60, 57, 63, 61, 64, 50, 62, 60, 56, 53, 62, 54, 60, 64, 53, 61, 58, 60, 64, 57, 56, 64, 61, 63} Use the data to answer the following questions.
The retirement ages of a group of steel workers are recorded below. Construct a histogram with 4 classes using Microsoft Excel, Google Sheets, or GeoGebra. You will upload the graph in the next question. {64, 60, 57, 63, 61, 64, 50, 62, 60, 56, 53, 62, 54, 60, 64, 53, 61, 58, 60, 64, 57, 56, 64, 61, 63} Use the data to answer the following questions.

Glencoe Algebra 1, Student Edition, 9780079039897, 0079039898, 2018
18th Edition
ISBN:9780079039897
Author:Carter
Publisher:Carter
Chapter10: Statistics
Section10.5: Comparing Sets Of Data
Problem 26PFA

Related questions
Question
100%
I need help with this!
Transcribed Image Text:Use Technology to Find Statistical Measures
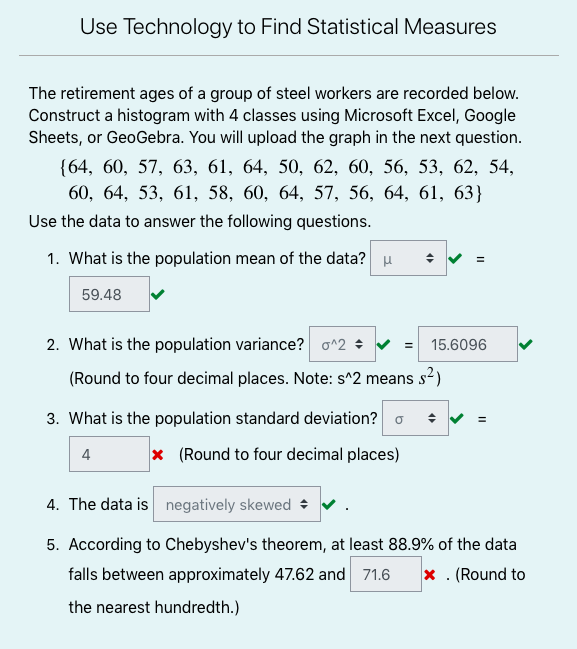
The retirement ages of a group of steel workers are recorded below.
Construct a histogram with 4 classes using Microsoft Excel, Google
Sheets, or GeoGebra. You will upload the graph in the next question.
{64, 60, 57, 63, 61, 64, 50, 62, 60, 56, 53, 62, 54,
60, 64, 53, 61, 58, 60, 64, 57, 56, 64, 61, 63}
Use the data to answer the following questions.
1. What is the population mean of the data? u
59.48
2. What is the population variance? o^2 + v =
15.6096
(Round to four decimal places. Note: s^2 means s2)
3. What is the population standard deviation? o
4
x (Round to four decimal places)
4. The data is negatively skewed +
5. According to Chebyshev's theorem, at least 88.9% of the data
falls between approximately 47.62 and 71.6
x . (Round to
the nearest hundredth.)
II
II
Expert Solution
This question has been solved!
Explore an expertly crafted, step-by-step solution for a thorough understanding of key concepts.

This is a popular solution!

Trending now
This is a popular solution!

Step by step
Solved in 3 steps with 2 images

Knowledge Booster


Learn more about
Need a deep-dive on the concept behind this application? Look no further. Learn more about this topic, statistics and related others by exploring similar questions and additional content below.Recommended textbooks for you
Glencoe Algebra 1, Student Edition, 9780079039897…
Algebra
ISBN:
9780079039897
Author:
Carter
Publisher:
McGraw Hill

Big Ideas Math A Bridge To Success Algebra 1: Stu…
Algebra
ISBN:
9781680331141
Author:
HOUGHTON MIFFLIN HARCOURT
Publisher:
Houghton Mifflin Harcourt

Holt Mcdougal Larson Pre-algebra: Student Edition…
Algebra
ISBN:
9780547587776
Author:
HOLT MCDOUGAL
Publisher:
HOLT MCDOUGAL
Glencoe Algebra 1, Student Edition, 9780079039897…
Algebra
ISBN:
9780079039897
Author:
Carter
Publisher:
McGraw Hill
Big Ideas Math A Bridge To Success Algebra 1: Stu…
Algebra
ISBN:
9781680331141
Author:
HOUGHTON MIFFLIN HARCOURT
Publisher:
Houghton Mifflin Harcourt
Holt Mcdougal Larson Pre-algebra: Student Edition…
Algebra
ISBN:
9780547587776
Author:
HOLT MCDOUGAL
Publisher:
HOLT MCDOUGAL