What pattern would we see if this graph depicted means instead of medians?

Chapter4: Linear Functions
Section4.3: Fitting Linear Models To Data
Problem 22SE: The U.S. Census tracks the percentage of persons 25 years or older who are college graduates. That...

Related questions
Question
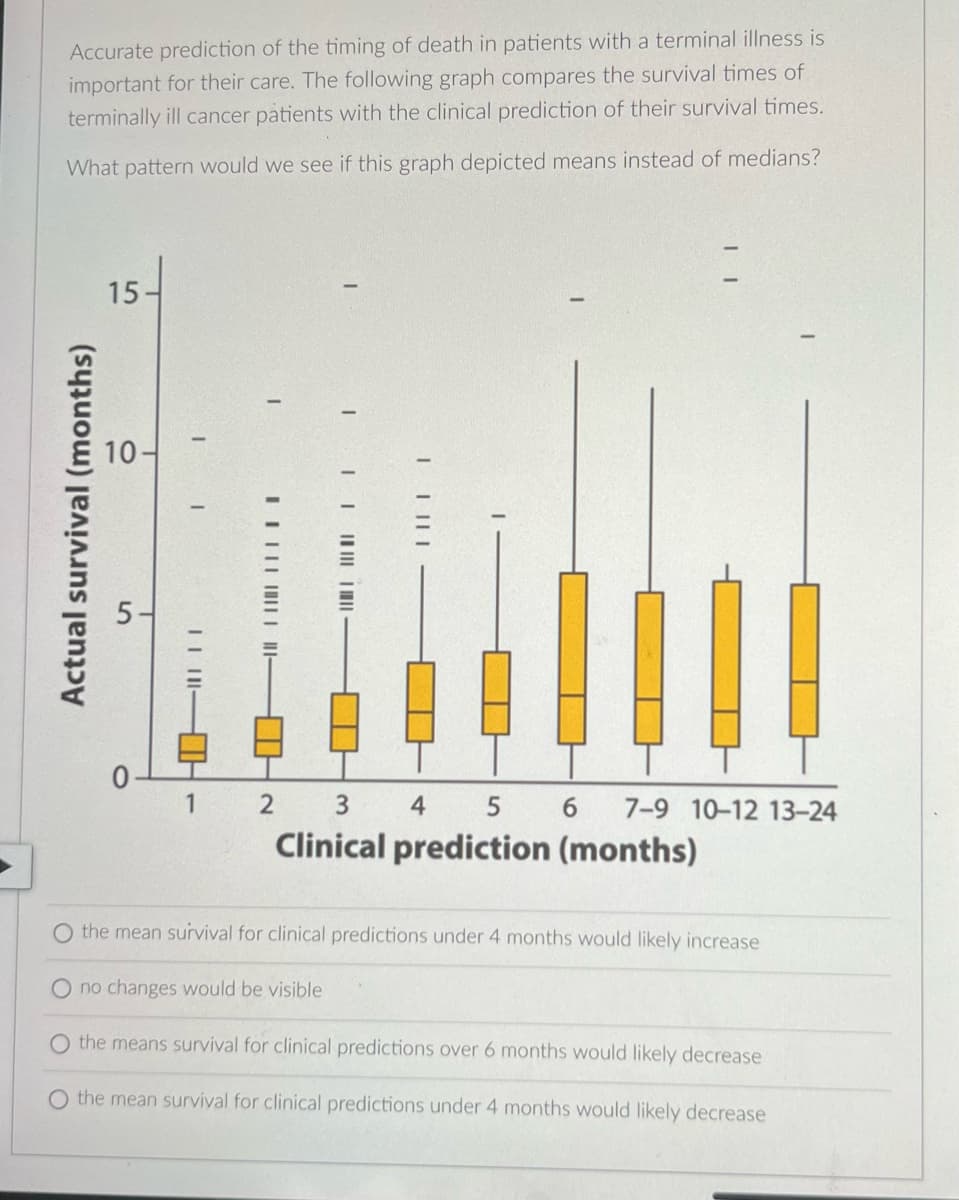
Transcribed Image Text:Accurate prediction of the timing of death in patients with a terminal illness is
important for their care. The following graph compares the survival times of
terminally ill cancer patients with the clinical prediction of their survival times.
What pattern would we see if this graph depicted means instead of medians?
Actual survival (months)
15-
10-
5
I
1
|||||
1
||||||||||
-Ill
I
|||||||||
|||||
2 3
Clinical prediction (months)
4
5 6 7-9 10-12 13-24
the mean survival for clinical predictions under 4 months would likely increase
O no changes would be visible
O the means survival for clinical predictions over 6 months would likely decrease
O the mean survival for clinical predictions under 4 months would likely decrease
Expert Solution
This question has been solved!
Explore an expertly crafted, step-by-step solution for a thorough understanding of key concepts.

This is a popular solution!

Trending now
This is a popular solution!

Step by step
Solved in 2 steps

Recommended textbooks for you

Glencoe Algebra 1, Student Edition, 9780079039897…
Algebra
ISBN:
9780079039897
Author:
Carter
Publisher:
McGraw Hill

Algebra & Trigonometry with Analytic Geometry
Algebra
ISBN:
9781133382119
Author:
Swokowski
Publisher:
Cengage
Glencoe Algebra 1, Student Edition, 9780079039897…
Algebra
ISBN:
9780079039897
Author:
Carter
Publisher:
McGraw Hill
Algebra & Trigonometry with Analytic Geometry
Algebra
ISBN:
9781133382119
Author:
Swokowski
Publisher:
Cengage