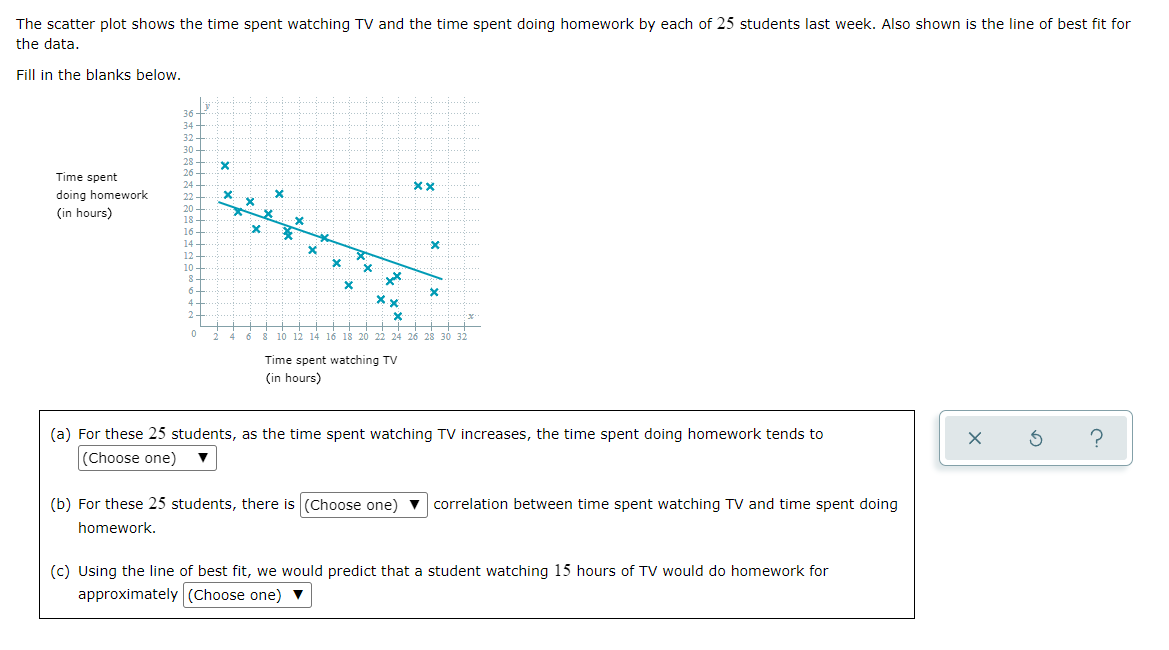
The scatter plot shows the time spent watching TV and the time spent doing homework by each of 25 students last week. Also shown is the line of best fit for the data. Fill in the blanks below. 36 34 32 30 28 26- Time spent 24 xx doing homework 22 20- (in hours) 18+ 16 x 14 12 10+ 8- ** x 6 ·x 4 x.x 2+ * H +++ H 0 2 4 6 8 10 12 14 16 18 20 22 24 26 28 30 32 Time spent watching TV (in hours) Ś ? (a) For these 25 students, as the time spent watching TV increases, the time spent doing homework tends to (Choose one) ▼ (b) For these 25 students, there is (Choose one) correlation between time spent watching TV and time spent doing homework. (c) Using the line of best fit, we would predict that a student watching 15 hours of TV would do homework for approximately (Choose one) ▼ X X m X x * ...* xx x 2 x X x X
The scatter plot shows the time spent watching TV and the time spent doing homework by each of 25 students last week. Also shown is the line of best fit for the data. Fill in the blanks below. 36 34 32 30 28 26- Time spent 24 xx doing homework 22 20- (in hours) 18+ 16 x 14 12 10+ 8- ** x 6 ·x 4 x.x 2+ * H +++ H 0 2 4 6 8 10 12 14 16 18 20 22 24 26 28 30 32 Time spent watching TV (in hours) Ś ? (a) For these 25 students, as the time spent watching TV increases, the time spent doing homework tends to (Choose one) ▼ (b) For these 25 students, there is (Choose one) correlation between time spent watching TV and time spent doing homework. (c) Using the line of best fit, we would predict that a student watching 15 hours of TV would do homework for approximately (Choose one) ▼ X X m X x * ...* xx x 2 x X x X

Algebra & Trigonometry with Analytic Geometry
13th Edition
ISBN:9781133382119
Author:Swokowski
Publisher:Swokowski
Chapter3: Functions And Graphs
Section3.3: Lines
Problem 76E

Related questions
Question
Transcribed Image Text:The scatter plot shows the time spent watching TV and the time spent doing homework by each of 25 students last week. Also shown is the line of best fit for
the data.
Fill in the blanks below.
36
34
32
30+
28
26+
XX
Time spent
doing homework
(in hours)
24
22+
20
18+
16
14
x
12+
10
xx
X
·*
xx
X
0
2 4
8 10 12 14 16 18 20 22 24 26 28 30 32
Time spent watching TV
(in hours)
5
?
(a) For these 25 students, as the time spent watching TV increases, the time spent doing homework tends to
(Choose one)
(b) For these 25 students, there is (Choose one) ▼ correlation between time spent watching TV and time spent doing
homework.
(c) Using the line of best fit, we would predict that a student watching 15 hours of TV would do homework for
approximately (Choose one)
8
6
4
2
X
X
*
x
X
x
N
x
X.
·x
X
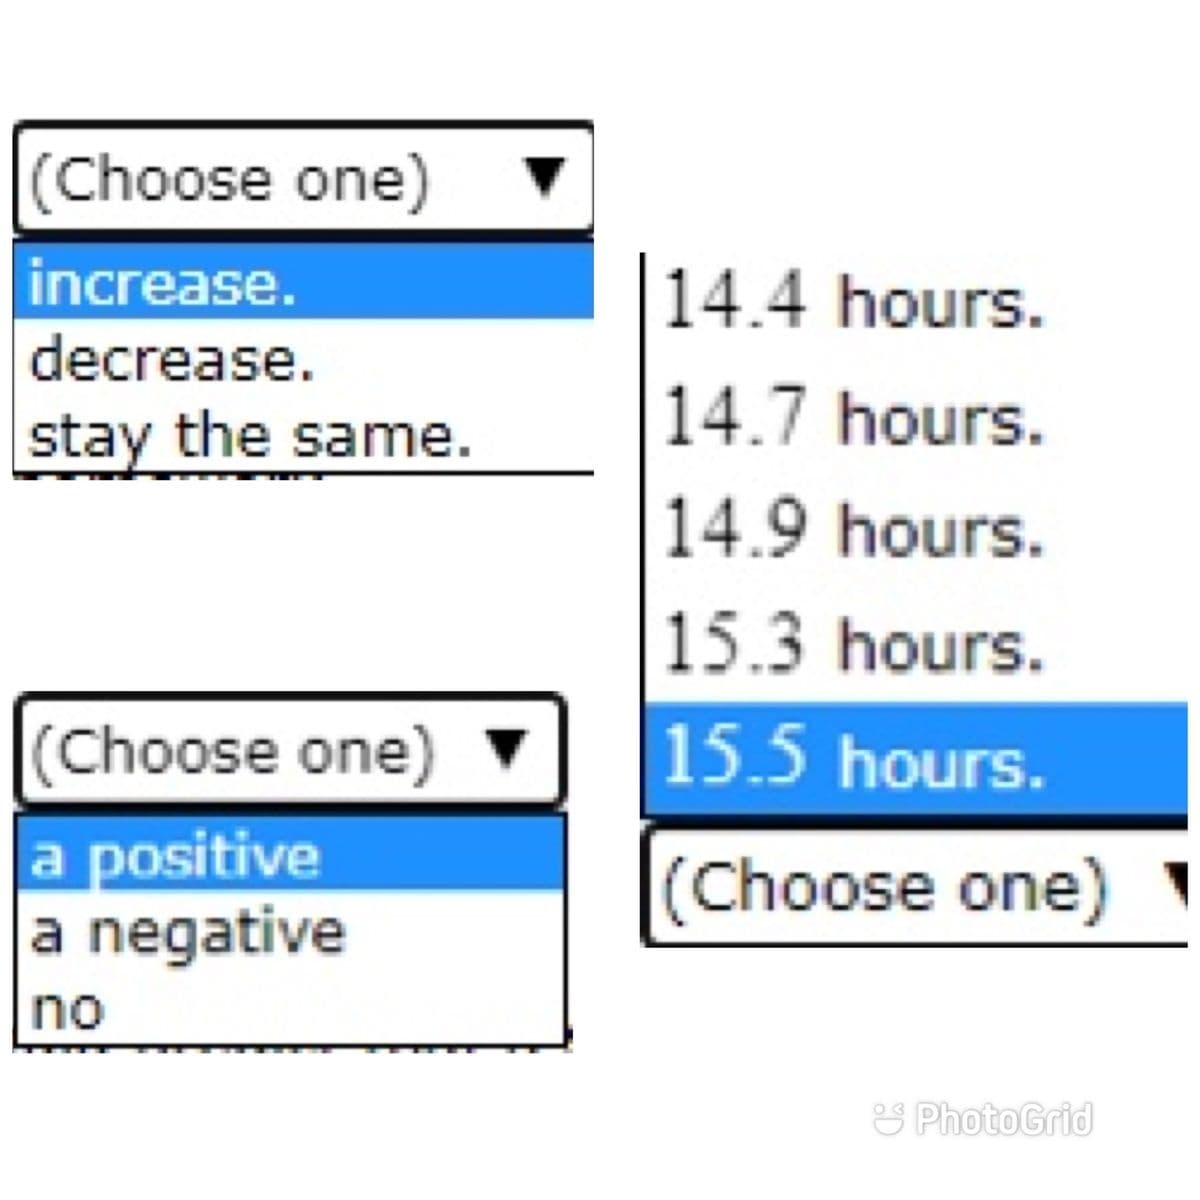
Transcribed Image Text:(Choose one)
increase.
decrease.
stay the same.
(Choose one)
a positive
a negative
no
▼
14.4 hours.
14.7 hours.
14.9 hours.
15.3 hours.
15.5 hours.
(Choose one)
PhotoGrid
Expert Solution
This question has been solved!
Explore an expertly crafted, step-by-step solution for a thorough understanding of key concepts.

This is a popular solution!

Trending now
This is a popular solution!

Step by step
Solved in 3 steps

Recommended textbooks for you
Algebra & Trigonometry with Analytic Geometry
Algebra
ISBN:
9781133382119
Author:
Swokowski
Publisher:
Cengage

Glencoe Algebra 1, Student Edition, 9780079039897…
Algebra
ISBN:
9780079039897
Author:
Carter
Publisher:
McGraw Hill

Algebra & Trigonometry with Analytic Geometry
Algebra
ISBN:
9781133382119
Author:
Swokowski
Publisher:
Cengage
Glencoe Algebra 1, Student Edition, 9780079039897…
Algebra
ISBN:
9780079039897
Author:
Carter
Publisher:
McGraw Hill

Trigonometry (MindTap Course List)
Trigonometry
ISBN:
9781337278461
Author:
Ron Larson
Publisher:
Cengage Learning