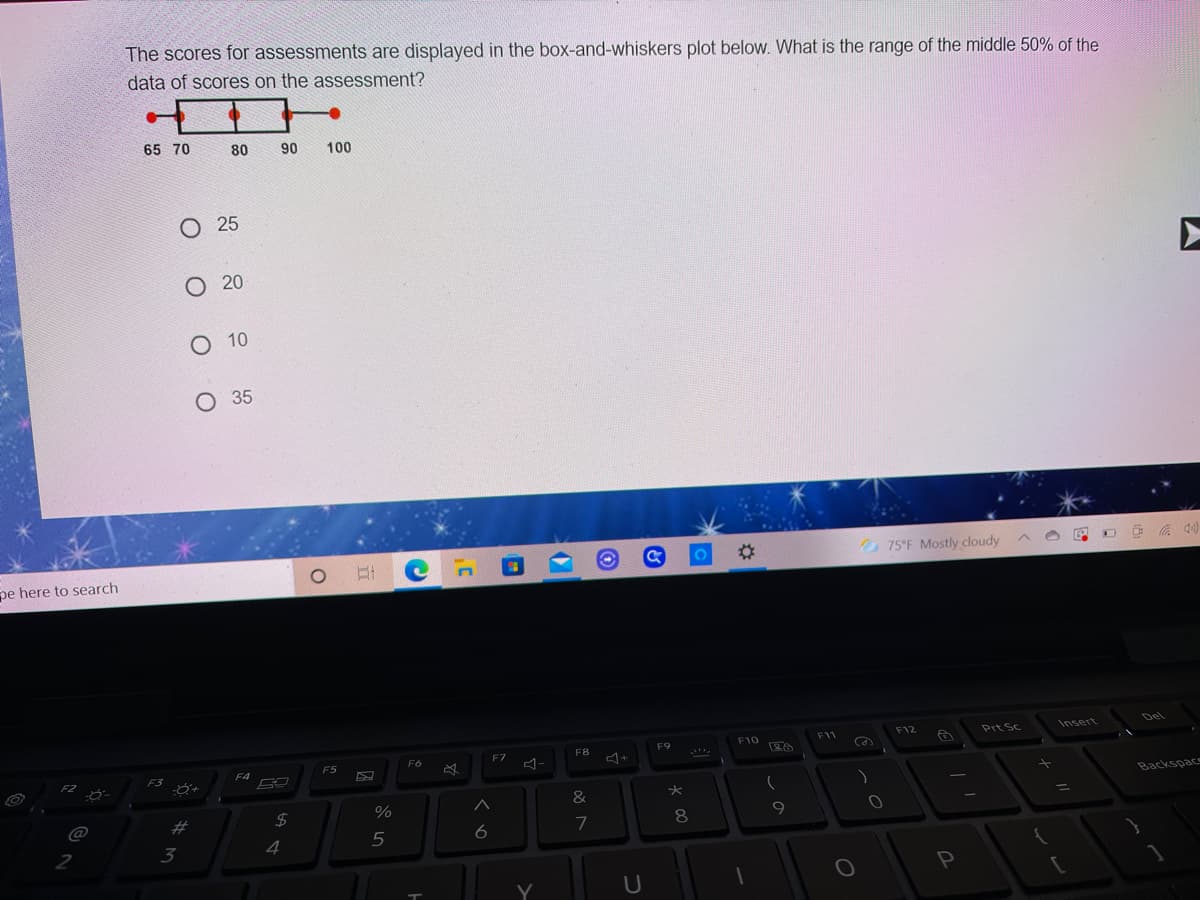
The scores for assessments are displayed in the box-and-whiskers plot below. What is the range of the middle 50% of the data of scores on the assessment? 65 70 80 90 100 O 25 O 20 10 35


Q: 6. You got 91 in this statistics subject. How well did you do relative to all of the students who to...
A: I solved exactly first question because of bartleby policy if you want more please upload separately...
Q: study indicates that 18- to 24- year olds spend a mean of 115 minutes watching video on their smar...
A:
Q: The shaded area under the standard curve shown 0.3015. Determine z
A: Note: This probability value calculated from standard normal distribution table
Q: A CNC (computer numerical control) machine produces iron automobile crankshafts. Samples are measure...
A: sample mean 'x̄= 1.0056 sample size n= 9 std deviation s= 0.0246 std error ='sx=s/√n=...
Q: The police department wants to reduce the margin of error for their 95% confidence interval. If they...
A: Here Given The police department wants to reduce the margin of error for their 95% confidence inter...
Q: Fifteen (15) samples of water were collected from a certain treatment facility in order to gain some...
A: Given information: Sample size, n=15 Upper Prediction limit formula: df=n-1=15-1=14 Confidence lev...
Q: A culture of a certain bacterium grows according to the law of exponential growth. If there were 130...
A: 1. The exponential growth is given by the where N(t) is the no of insects at a time t .N0 is the in...
Q: Average marks in Statistics of 10 students of a class was 68. A new student took admission with 72 m...
A:
Q: The compliment of guessing 3 correct answers on a 4-multiple-choice quiz is?
A: From the given data, we have to say that The compliment of guessing 3 correct answers on a 4-multipl...
Q: CI on Variance Defective alternator and corroded or loose battery charges are a few of the main caus...
A: Given : Sample size (n) = 5 Sample : 1.9 , 2.4 , 3.0 , 3.5 , 4.2 Confidence level = 95% Significance...
Q: The mean weight of 15 wrestlers is 110 kgs. The mean weight of 5 of them is 100 kgs and another 5 is...
A: Given that, the mean weight of 15 wrestlers is 110 kgs. The mean weight of 5 of them is 100 kgs and ...
Q: You wish to test the following claim (HaHa) at a significance level of α=0.10α=0.10.
A: Here use given null and alternative hypothesis to perform the hypothesis testing
Q: a) The maintenance department has tested the batteries in one of its stores. The tested batteries we...
A: Here, we have to calculate the mean and variance of given grouped data.
Q: Suppose we run a regression of Y on X using the following data points( xy)in a sample: (0, 1,(1,2).(...
A: Given that Suppose we run a regression of Y on X using the following data points( x, y)in a sample:...
Q: f Class Interval fx cf (x - mean)^2 f(x - mean)^2 X- mean Frequency Class Mark 95-99 3 90-94 85-89 1...
A: Arrange the Given data is ascending order Class Interval Frequency 60 - 64 4 65 - 69 9 70 ...
Q: Not rejecting the null hypothesis when it is true would also mean that the alternative hypothesis is...
A: Null and alternative hypotheses: Null hypothesis: The null hypothesis is a statement that indicates ...
Q: stration 10.24. A sample of 10 numbers gave a mean of 13 and a variance of 4. Later it was discovere...
A: Central tendency measure the average of the data set. Dispersion measures the deviation of data set ...
Q: is the sum of Suppose an interval has frequency f. If the class interval with the lowest value is at...
A: Here understand given scenario with example
Q: A certain type of cold vaccine is known to be only 25% effective after a period of 2 years. To deter...
A: Test is that whether a new vaccine is superior in providing protection against the virus for a longe...
Q: CI on the Mean, Variance Known A normal distribution has known population mean 50 and a variance of ...
A:
Q: The prediction interval for Xn+1 will always be longer than the confidence interval for u True False
A: Prediction intervals must account for both the uncertainty in estimating the population mean, plus t...
Q: Jim is a 60-year-old male in reasonably good health. He wants to take out a $50,000 term (that is, s...
A: Given: X=age 60 61 62 63 64 P(death at this age) 0.01191 0.01292 0.01396 0...
Q: 2 Suppose that player A plays the mixed strategy 3' and player B plays the mixed 9' (G) strategy Fin...
A: Given that player A plays the mixed strategy 23,29,19.
Q: A manufacturer knows that their items have a normally distributed lifespan, with a mean of 11.5 year...
A:
Q: Suppose an interval has frequency f. If the class interval with the lowest value is at the lowest ro...
A: A frequency is the no. of times a data value occurs.
Q: CI on the Mean, Variance Known A normal distribution has known population mean 50 and a variance of ...
A: The population follows the population mean 50 and variance 4. For sample sizes 16, 32 and 48, the pr...
Q: ELT(Let) the joint probabilty density function of two con random variable Y and X Find P(Y>=X) Fi...
A:
Q: For the following data find the Standard deviation of the sample(round to the nearest tenths place) ...
A: Given data is23,20,19,27,18,30,28,28,24,24,20,40,57,18,20,23,23,24,25,27sample size(n)=20
Q: 5. State the probability of the following events. Represent your solution as a probability first the...
A:
Q: The amount of money spent on online foods by customers at an online restaurant follows a normal dist...
A:
Q: Calculate Quartile Deviation and its Coefficient from the following data : Weight (in pounds) 120 12...
A:
Q: 3. Are the events of "holding cross country practice" and "raining at the end of the school day" dep...
A:
Q: 1. What is the value of n? 2. What is the value of of the summation of product of X and Y? 3. what i...
A:
Q: TITLE: DELICIOUS MILKTEA AND SNACKS: A COMPREHENSIVE DATA ANALYSIS REPORT ON CUSTOMERS SATISFACTION ...
A: Given information: Total number of respondent = 20 Number of respondent strongly agree with the sati...
Q: 1) Determine the probability of a random applicant getting automatically rejected. 2) If 6 applicant...
A:
Q: 10:44 1 l LTE A go.room.sh sure 10:27 thankyou SS 10:27 Student The national council of small busine...
A:
Q: 3.A very desperate student needs to have a passing grade in his major subject to graduate. He got 70...
A: “Since you have asked multiple questions, we will solve the first question for you. If you want any ...
Q: II. IDENTIFICATION: Identify the parameter to be tested and formulate the null and altemative hypoth...
A: We have given that Sample size n =50 Population mean μ =74 NOTE:- According to bartleby guidelines ...
Q: EXАMPLE 3. P(X) Find u and o. 2 0.042 0.010 4 0.021 0.375 0.188 7 0.344 8 0.021
A:
Q: Which of the following is NOT part of descriptive statistics? (A Collection data (B An inference mad...
A: We know that, The descriptive statistics consists collection of data , summarizing of data and prese...
Q: A fine dining restaurant claims that the group sizes of their customers follows the following distri...
A: a) The hypotheses are: H0: The distribution of customers for each group is the same as claimed by th...
Q: In a frequency distribution the coefficient of skewness based on quartiles is *0.6. If the sum of th...
A:
Q: ß increases as µ approaches Howhen H, is false True False
A: Note: Hi, thank you for the question. As per our company guideline we are supposed to answer only fi...
Q: CI on Mean, Variance Known Students on an internship program in the US Fish and Wildlife Service wis...
A: Here use confidence interval formula
Q: Find the probability that a randomly selected group of five adults will contain all women. Give your...
A: Let the probability of selecting a man and woman is 1/2
Q: the population mean. II. The central limit theorem is used to conclude that the distribution of the...
A: central limit theorem we we know that, distribution of sample mean is approximately normal when sam...
Q: A random sample of 750 registered voters in Phoenix is asked if they favor the use of oxygenated fue...
A:
Q: Suppose IQ scores are approximately normally distributed with a mean of 100 and a standard deviation...
A: Given that, IQ scores are approximately normally distributed with a mean of 100 and a standard devia...
Q: 3)Find the Median, Mode and Mean of s the Scores below: Inchude Mean Deviation Methad. Classes Fregu...
A: Solution-: We have following table: We find median, mode and mean: include mean deviation method
Q: (Upload the picture of your solutions) Six people A, B, C, D,E, and F get into a bus that has five ...
A:

Step by step
Solved in 2 steps with 1 images

- Develop the frequency table of the data From the frequency table, calculate each of the following a) Average d) Inter quartile range (Q3 – Q1) b) Median e) Standard deviation c) 55th percentile – 3rd decile f) Coefficient of variationFind the mean of the data from the frequency table: Value Frequency 0 6 1 0 2 6 3 8 4 9 5 6 Give your answer to two decimal places.Consider the following ordered data.2 5 5 6 7 7 8 9 10 Find the low, Q1, median, Q3, and high. b) Find the interquartile range c) Make a box-and-whisker plot
- What does the z=? what is the p value?The following are the raw score for the 90-item examination in Statistics of the 50 students in 10th Grade. Solve for the: A. Frequency Distribution Table B. D2 (2nd Decile) C. D5 (5th decile) D. D7 (7th decile) E. D9 (9th decile)COMPLETE ALL 5 STEPS TO ANSWER THE QUESTIONS. Is the stance on the death penalty independent of sex? Their obtained frequencies are: Male (Favor: 797; oppose: 423) Female (Favor: 832; oppose: 643) Column marginal (Male: 1220; Female: 1475) row marginal (Favor: 1629; oppose: 1066) N = 2695 Step 3: With α =.10 , what is your critical score? a: 2.706 b: 3.841 c: 6.635 d: 10.828
- Consider the following ordered data. 2 5 5 6 7 7 8 9 10 (a) Find the low, Q1, median, Q3, and high. low Q1 median Q3 high (b) Find the interquartile range.(c) Make a box-and-whisker plot.Which of the following tools is most suitable to analyse the relationship between two quantitative variables? a. Cramer's V coefficient b. Contingency tables c. Bar graphs d. Scatter plotWhat are the most likely values of r for each plot of data shown below? Figure 1 *AT THE TOP r = -0.5 r = 0 r= 0.5 r = 1 ? Answer: Figure 2 *AT THE Bottom r = -0.5 r = 0 r= 0.5 r = 1 ? Answer:
- Find the value of m, b, and A so that f fits the data.Look at the relative frequency table above. What is P(X = 3)?The following are the raw score for the 90-item examination in Statistics of the 50 students in 10th Grade. Solve for the: A. Frequency Distribution Table - use 7 classes B. D2 (2nd Decile) - based on the frequency distribution table C. D5 (5th decile) - based on the frequency distribution table D. D7 (7th decile) - based on the frequency distribution table E. D9 (9th decile) - based on the frequency distribution table