The shoe sizes (inches) of 20 female students. Ba

MATLAB: An Introduction with Applications
6th Edition
ISBN:9781119256830
Author:Amos Gilat
Publisher:Amos Gilat
Chapter1: Starting With Matlab
Section: Chapter Questions
Problem 1P

Related questions
Question
The shoe sizes (inches) of 20 female students. Based it from ztable and use scientific calculator thanks
Transcribed Image Text:4945 44
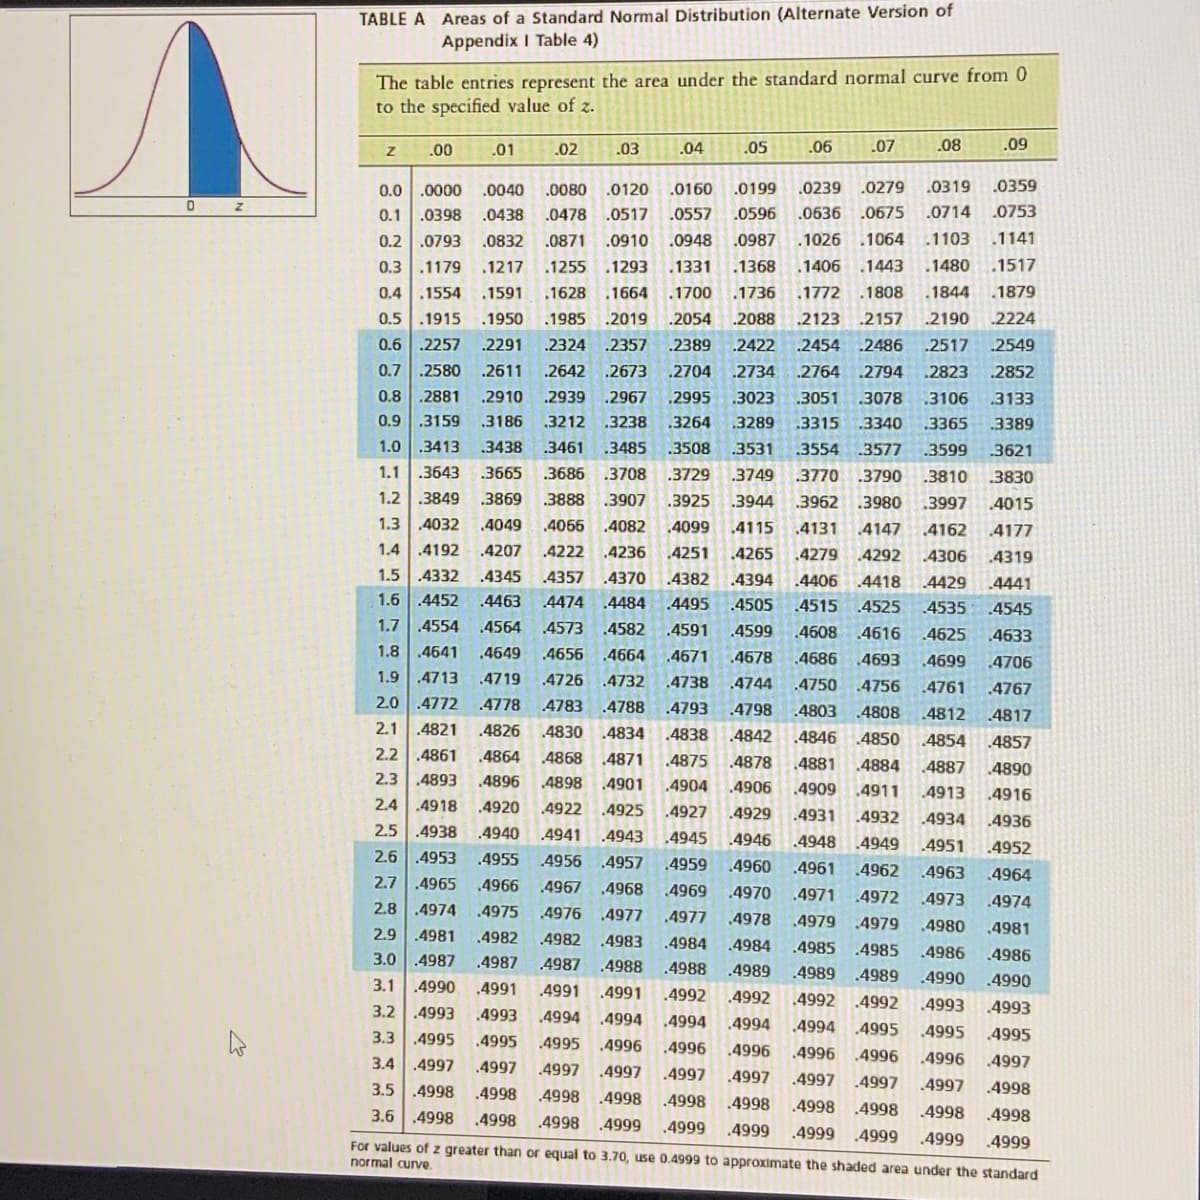
TABLE A Areas of a Standard Normal Distribution (Alternate Version of
Appendix I Table 4)
The table entries represent the area under the standard normal curve from 0
to the specified value of z.
.00
.01
.02
.03
.04
.05
.06
.07
.08
.09
0.0 .0000
.0040
.0080
.0120
.0160
.0199
.0239
.0279
.0319
.0359
0.1
.0398
.0438
.0478
.0517
.0557
.0596
.0636
.0675
.0714
.0753
0.2
.0793
.0832
.0871
.0910
.0948
.0987
.1026
.1064
1103
.1141
0.3.1179
.1217
.1255
1293
.1331
.1368
.1406
.1443
1480
.1517
0.4.1554
.1591
.1628
.1664
.1700
.1736
.1772 .1808
1844
1879
0.5 .1915
.1950
.1985
.2019
.2054
.2088
.2123
.2157
2190
2224
0.6 .2257
.2291
.2324
.2357
.2389
.2422
.2454 .2486
2517
2549
0.7
.2580
.2611
.2642
.2673
.2704
.2734
.2764 .2794
.2823
2852
0.8
.2881
.2910
.2939
.2967
.2995
.3023
.3051
.3078
3106
3133
0.9
.3159
.3186
3212
.3238
.3264
.3289
.3315
.3340
.3365
3389
1.0 .3413
1.1 .3643
.3438
.3461
.3485
.3508
.3531
.3554
3577
.3599
3621
.3665
.3686
.3708
.3729
3749
.3770
.3790
3810
3830
1.2 .3849
.3869
.3888
.3907
.3925
3944
.3962
.3980
.3997
4015
1.3 .4032
.4049
,4066
.4082
.4099
.4115
4131
4147
.4162
4177
1.4.4192
.4207
.4222
.4236
.4251
.4265
.4279
.4292
.4306
.4319
1.5 .4332
.4345
.4357 .4370
.4382
.4394
.4406
.4418
.4429
.4441
1.6 .4452
.4463
4474
.4484
.4495
.4505
4515
4525
.4535
4545
1.7
.4554
.4564
.4573
.4582
4591
.4599
.4608
.4616
.4625
4633
1.8 .4641
.4649
.4656
.4664
.4671
.4678
.4686
.4693
.4699
4706
1.9
.4713
.4719
.4726
.4732
.4738
.4744
.4750
.4756
.4761
.4767
2.0 .4772
2.1 .4821
.4778
.4783
.4788
.4793
.4798
.4803
4808
4812
4817
.4826
4830
4834
4838
.4842
.4846
.4850
4854
4857
2.2
.4861
.4864
.4868
.4871
.4875
.4878
.4881
4884
4887
.4890
2.3 .4893
.4896
.4898
.4901
.4904
.4906
.4909
4911
.4913
.4916
2.4
.4918
.4920
.4922
.4925
.4927
.4929
.4931
.4932
.4934
.4936
2.5 .4938
.4940
.4941
.4943
.4948
.4949
.4951
.4952
2.6 4953
.4955
4956
.4957
.4959
4960
.4961
.4962
4963
.4964
2.7 .4965
.4966
.4967 4968
.4969
.4970
.4971
4972
.4973
.4974
2.8.4974
.4975
4976
.4977
.4977
.4978
.4979
4979
.4980
.4981
2.9 .4981
.4982
.4982
.4983
.4984
.4984
.4985
.4985
.4986
.4986
3.0 .4987
.4987
.4987
.4988
.4988
.4989
.4989
.4989
.4990
.4990
3.1
.4990
.4991
.4991
.4991
.4992
.4992
4992
.4992
.4993
4993
3.2
.4993
.4993
.4994
.4994
.4994
3.3 4995
4994
.4994
.4995
.4995
,4995
.4995
.4996
4995
.4996
.4996
.4996
.4996
3.4 .4997
.4997
.4996
.4997
.4997
.4997
.4997
.4997
.4997
4997
.4997
.4998
3.5 .4998
3.6.4998
.4998
.4998
.4998
.4998
.4998
.4998
.4998
.4998
.4998
.4998
.4998
.4999
.4999
For values of z greater than or equal to 3.70, use 0.4999 to approximate the shaded area under the standard
.4999
.4999
.4999
.4999 4999
normal curve.
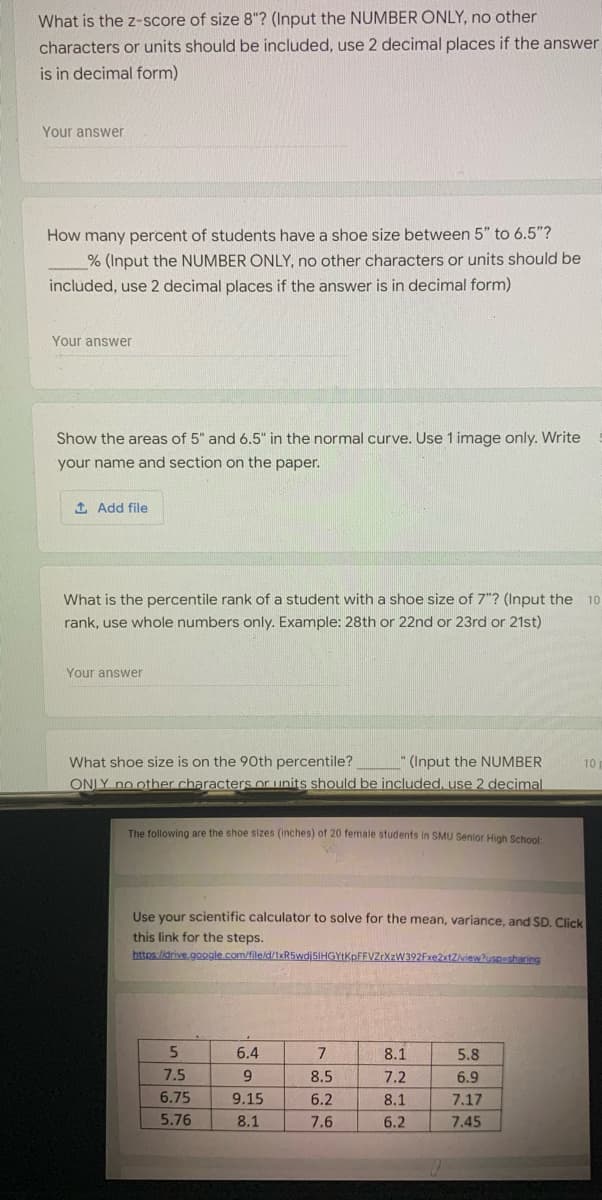
Transcribed Image Text:What is the z-score of size 8"? (Input the NUMBER ONLY, no other
characters or units should be included, use 2 decimal places if the answer
is in decimal form)
Your answer
How many percent of students have a shoe size between 5" to 6.5"?
% (Input the NUMBER ONLY, no other characters or units should be
included, use 2 decimal places if the answer is in decimal form)
Your answer
Show the areas of 5" and 6.5" in the normal curve. Use 1 image only. Write
your name and section on the paper.
1 Add file
What is the percentile rank of a student with a shoe size of 7"? (Input the
10
rank, use whole numbers only. Example: 28th or 22nd or 23rd or 21st)
Your answer
What shoe size is on the 90th percentile?
(Input the NUMBER
10
ONLY no other characters or units should be included, use 2 decimal
The following are the shoe sizes (inches) of 20 female students in SMU Senior High School:
Use your scientific calculator to solve for the mean, variance, and SD. Click
this link for the steps.
https:/idrive.google com/file/d/1xR5wdjsIHGYtKpFFVZrXzW392Fxe2xtZview?uspusharing
5.
6.4
7
8.1
5.8
7.5
9.
8.5
7.2
6.9
6.75
9.15
6.2
8.1
7.17
5.76
8.1
7.6
6.2
7.45
Expert Solution
This question has been solved!
Explore an expertly crafted, step-by-step solution for a thorough understanding of key concepts.

Step by step
Solved in 3 steps

Recommended textbooks for you
MATLAB: An Introduction with Applications
Statistics
ISBN:
9781119256830
Author:
Amos Gilat
Publisher:
John Wiley & Sons Inc

Probability and Statistics for Engineering and th…
Statistics
ISBN:
9781305251809
Author:
Jay L. Devore
Publisher:
Cengage Learning

Statistics for The Behavioral Sciences (MindTap C…
Statistics
ISBN:
9781305504912
Author:
Frederick J Gravetter, Larry B. Wallnau
Publisher:
Cengage Learning
MATLAB: An Introduction with Applications
Statistics
ISBN:
9781119256830
Author:
Amos Gilat
Publisher:
John Wiley & Sons Inc
Probability and Statistics for Engineering and th…
Statistics
ISBN:
9781305251809
Author:
Jay L. Devore
Publisher:
Cengage Learning
Statistics for The Behavioral Sciences (MindTap C…
Statistics
ISBN:
9781305504912
Author:
Frederick J Gravetter, Larry B. Wallnau
Publisher:
Cengage Learning

Elementary Statistics: Picturing the World (7th E…
Statistics
ISBN:
9780134683416
Author:
Ron Larson, Betsy Farber
Publisher:
PEARSON

The Basic Practice of Statistics
Statistics
ISBN:
9781319042578
Author:
David S. Moore, William I. Notz, Michael A. Fligner
Publisher:
W. H. Freeman

Introduction to the Practice of Statistics
Statistics
ISBN:
9781319013387
Author:
David S. Moore, George P. McCabe, Bruce A. Craig
Publisher:
W. H. Freeman