The slope (aka regression coefficient) can be • The sign or integer confirms the relation The y intercept can be solved using the form o Note that you are solving for the value o o Substitute the values of ỹ and x from the
The slope (aka regression coefficient) can be • The sign or integer confirms the relation The y intercept can be solved using the form o Note that you are solving for the value o o Substitute the values of ỹ and x from the

Algebra and Trigonometry (MindTap Course List)
4th Edition
ISBN:9781305071742
Author:James Stewart, Lothar Redlin, Saleem Watson
Publisher:James Stewart, Lothar Redlin, Saleem Watson
Chapter1: Equations And Graphs
Section1.FOM: Focus On Modeling: Fitting Lines To Data
Problem 7P

Related questions
Question
100%
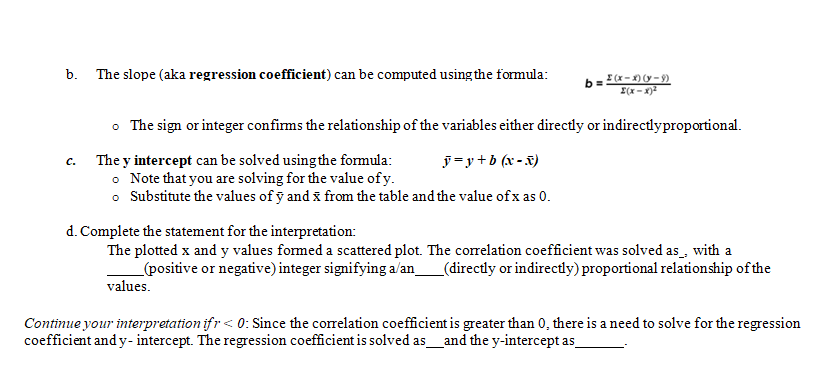
Transcribed Image Text:b. The slope (aka regression coefficient) can be computed using the formula:
b =
I (x-) (y - 9)
I(x-x)2
• The sign or integer confirms the relationship of the variables either directly or indirectlyproportional.
ỹ=y+b (x - x)
The y intercept can be solved using the formula:
• Note that you are solving for the value of y.
o Substitute the values of ỹ and x from the table and the value of x as 0.
с.
d. Complete the statement for the interpretation:
The plotted x and y values formed a scattered plot. The correlation coefficient was solved as_, with a
_(positive or negative) integer signifying a/an_(directly or indirectly) proportional relationship of the
values.
Continue your interpretation ifr< 0: Since the correlation coefficient is greater than 0, there is a need to solve for the regression
coefficient and y- intercept. The regression coefficient is solved as_and the y-intercept as
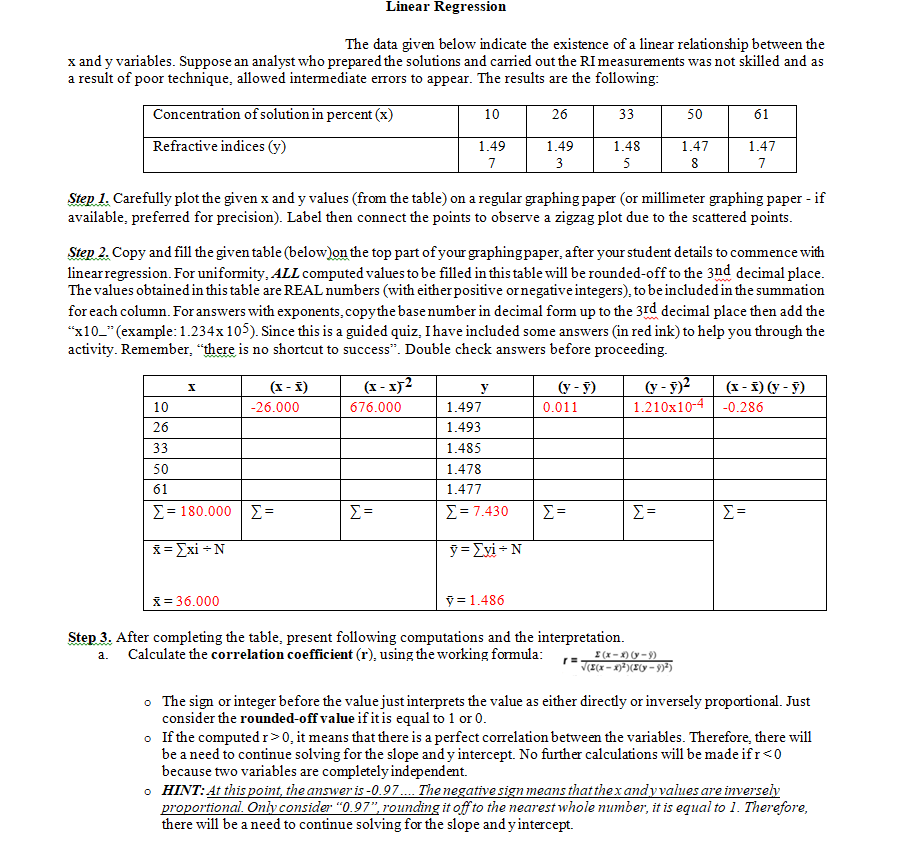
Transcribed Image Text:Linear Regression
The data given below indicate the existence of a linear relationship between the
x and y variables. Suppose an analyst who prepared the solutions and carried out the RI measurements was not skilled and as
a result of poor technique, allowed intermediate errors to appear. The results are the following:
Concentration of solution in percent (x)
10
26
33
50
61
Refractive indices (y)
1.49
1.49
1.48
1.47
1.47
7
5
8
7
Step 1. Carefully plot the given x and y values (from the table) on a regular graphing paper (or millimeter graphing paper - if
available, preferred for precision). Label then connect the points to observe a zigzag plot due to the scattered points.
Step 2. Copy and fill the given table (below)on the top part of your graphing paper, after your student details to commence with
linearregression. For uniformity, ALL computed values to be filled in this table will be rounded-off to the 3nd decimal place.
The values obtainedin this table are REAL numbers (with eitherpositive ornegative integers), to be included in the summation
for each column. For answers with exponents, copythe base number in decimal form up to the 3rd decimal place then add the
"x10_"(example:1.234x 10⁵). Since this is a guided quiz, Ihave included some answers (in red ink) to help you through the
activity. Remember, "there is no shortcut to success". Double check answers before proceeding.
(x - x)2
(y - y)?
1.210x10⁻⁴
(x - £) (y - §)
(x - f)
y
(y - y)
10
-26.000
676.000
1.497
0.011
-0.286
26
1.493
33
1.485
50
1.478
61
1.477
Σ- 180.000 | Σ-
E =
Σ- 7.430
Σ
Σ
X= Exi +N
ỹ = Exi - N
X= 36.000
ỹ = 1.486
Step 3. After completing the table, present following computations and the interpretation.
Calculate the correlation coefficient (r), using the working formula:
I(x-X) (y-9)
V(I(x – x)³)(X(y = 9)*)
a.
• The sign or integer before the value just interprets the value as either directly or inversely proportional. Just
consider the rounded-off value if it is equal to 1 or 0.
o If the computed r>0, it means that there is a perfect correlation between the variables. Therefore, there will
be a need to continue solving for the slope and y intercept. No further calculations will be made ifr<0
because two variables are completely independent.
o HINT: At this point, the answer is -0.97.. The negative sign means that thex andyvalues are inversely
proportional. Ony consider "0.97", rounding it off to the nearest whole number, it is equal to 1. Therefore,
there will be a need to continue solving for the slope and y intercept.
Expert Solution
This question has been solved!
Explore an expertly crafted, step-by-step solution for a thorough understanding of key concepts.

Step by step
Solved in 4 steps with 3 images

Recommended textbooks for you
Algebra and Trigonometry (MindTap Course List)
Algebra
ISBN:
9781305071742
Author:
James Stewart, Lothar Redlin, Saleem Watson
Publisher:
Cengage Learning

College Algebra
Algebra
ISBN:
9781305115545
Author:
James Stewart, Lothar Redlin, Saleem Watson
Publisher:
Cengage Learning

Functions and Change: A Modeling Approach to Coll…
Algebra
ISBN:
9781337111348
Author:
Bruce Crauder, Benny Evans, Alan Noell
Publisher:
Cengage Learning
Algebra and Trigonometry (MindTap Course List)
Algebra
ISBN:
9781305071742
Author:
James Stewart, Lothar Redlin, Saleem Watson
Publisher:
Cengage Learning
College Algebra
Algebra
ISBN:
9781305115545
Author:
James Stewart, Lothar Redlin, Saleem Watson
Publisher:
Cengage Learning
Functions and Change: A Modeling Approach to Coll…
Algebra
ISBN:
9781337111348
Author:
Bruce Crauder, Benny Evans, Alan Noell
Publisher:
Cengage Learning

Glencoe Algebra 1, Student Edition, 9780079039897…
Algebra
ISBN:
9780079039897
Author:
Carter
Publisher:
McGraw Hill

Algebra & Trigonometry with Analytic Geometry
Algebra
ISBN:
9781133382119
Author:
Swokowski
Publisher:
Cengage