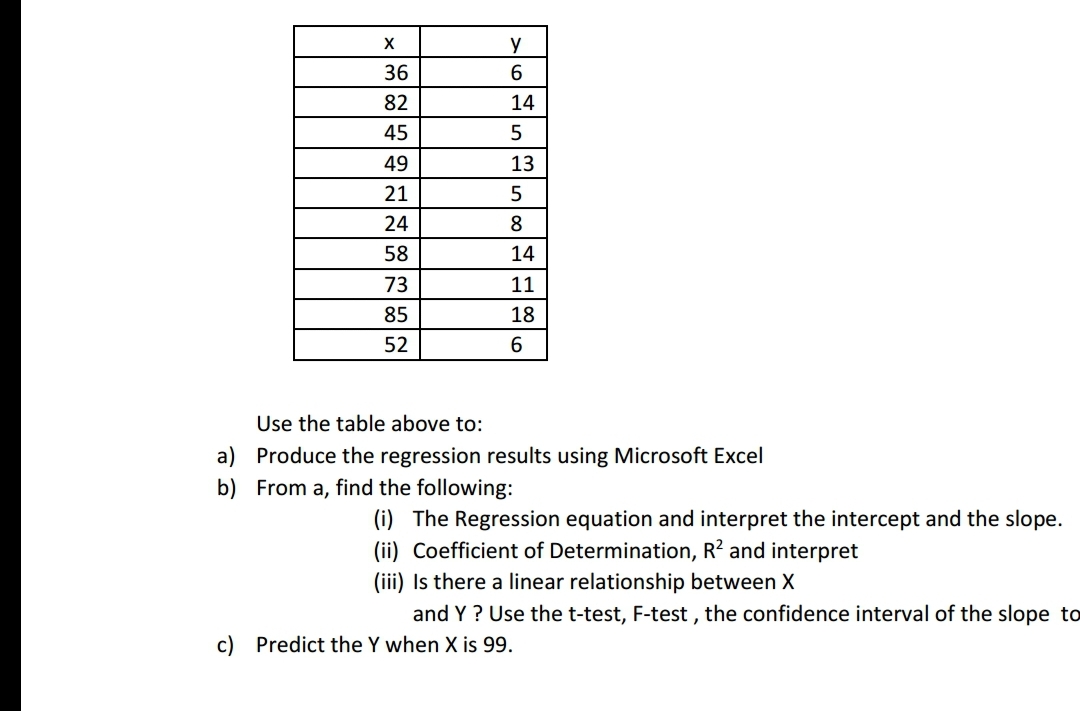
a) Produce the regression results using Microsoft Excel b) From a, find the following: (i) The Regression equation and interpret the intercept and the slope. (ii) Coefficient of Determination, R? and interpret (iii) Is there a linear relationship between X and Y ? Use the t-test, F-test , the confidence interval of the slope to c) Predict the Y when X is 99.


Q: A teacher plots the number of classes their students missed (x) with their scores on a test (y). The…
A: NOTE: Refresh your page if you can't see any equations. . the given equation is to find the…
Q: Use Microsoft Excel to generate regression output for this problem and use the information in the…
A:
Q: For a linear regression b1 is the estimated y-intercept, and b0 is the estimated slope of the…
A: Regression equation is : y=b0+b1x
Q: Select all the charts that violate the conditions for linear regression. (a) (b) (c)
A: Assumptions of linear regression are as follows: Terms should be normally distributed. There must…
Q: The accompanying data are the caloric contents and the sugar contents (in grams) of 11 high-fiber…
A: Enter the given data in Excel as shown below
Q: a) Using simple linear regression, find the forecasted quantity sold for Jiga Milk Tea if the price…
A: We have given there are two variable namely Price RM & Quantity sold in the table. Let us…
Q: The table shows the number of goals allowed and the total points earned (2 points for a win, and 1…
A: Performing data analysis we obtained, a) r2 =0.734544 = 0.73 About 73% of the variation in points…
Q: The equations of two lines of regression obtained in a correlation analysis are the following : 2X =…
A:
Q: d. Using the regression equation, draw the line of best fit on your scatterplot. Please use at least…
A: Scatter Plot: Scatter plot is the graphical representation of the relationship between two variables…
Q: The equation used to predict annual cauliflower yield (in pounds per acre) is y = 23,482 +4.455x,…
A: Given that the regression equation is, y^=23,482+4.455x1-4.602x2 a) Given that x1=37000 and…
Q: (b) Interpret the regression coefficient for the fitted model.
A: Given, n=30, Sxx=759.8148 s=4.69245
Q: Use the given data to find the best predicted value of the response variable. Ten pairs of data…
A: Solution: From the given information, the regression equation is y=2+3x.
Q: Develop the estimated regression equation by computing the values of bo and b. Use the estimated…
A: We have to calculate the estimated regression line and predict the value of y when x = 4
Q: Different hotels in a certain area are randomly selected, and their ratings and prices were…
A:
Q: A regression between foot length (response variable measured in cm) and height (ex- planatory…
A: Let Y be the response variable foot length measured in cm X is the explanatory variable height…
Q: se the given data to find the best predicted value of the response variable. Four pairs of data…
A: We have given that, r = 0.942 and regression equation y= 3x Also, y = 12.75. Then x We will find…
Q: 4. The relationship between voltages applied to an electrical circuit and the current flowing is…
A: current(x) Voltage(y) xy x2 y2 2 5 10 4 25 4 11 44 16 121 6 15 90 36 225 8 19 152 64…
Q: a. Develop an estimated regression equation with the amount of television advertising as the…
A: a. The regression analysis is conducted using EXCEL. The software procedure is given below: Enter…
Q: The equation used to predict annual cauliflower yield (in pounds per acre) is y = 23,255 +4.599x, -…
A: Hi! Thank you for the question, As per the honor code, we are allowed to answer three sub-parts at a…
Q: Find the regression equation, letting the first variable be the predictor (x) variable. Using the…
A: Given data, X Y X*Y X*X 225 16 3600 50625 269 15.9 4277.1 72361 361 15.6 5631.6 130321…
Q: a) Determine the regression equation. b) Estimate the final grade of a student who has a midterm…
A: Given: Student Midterm grade Final grade 1 82 83 2 84 81 3 78 80 4 76 75 5 86 88 6 90…
Q: Find the regression equation, letting the first variable be the predictor (x) variable. Using the…
A: Given data, X Y X*Y X*X 229 16 3664 52441 261 15.8 4123.8 68121 359 15.5 5564.5 128881…
Q: a. Find the sum of Y^2: b. Find the Correlation coefficient: c. Estimate the slope of the regression…
A: Given, Group X Y A 1 2 B 2 2 C 8 2 D 1 6 E 1 4 Let r be correlation coefficient Let…
Q: The accompanying table provides data for the sex, age, and weight of bears. For sex, let O represent…
A: The independent variables are Sex, Age. The dependent variable is Weight. We have to find the…
Q: Do these data provide sufficient evidence that there is a positive linear relationship between the…
A: Since you have posted a question with multiple sub-parts, we will solve first three sub-parts for…
Q: Q- The grades of a class of 9 students on a midterm report (x) and on the final examination (y) are…
A: Given information: The grades of a class of 9 students on a midterm report (x) and on the final…
Q: State the regression identity for degrees of freedom in this case of three predictor variables.
A: The regression identify for degrees of freedom with k predictors and n observations and having total…
Q: The regression equation is y
A: The diameter and circumferences are given and the regression equation is required. The diameter…
Q: The regression equation relating attitude rating(x) and job performance (y) for ten randomly…
A: Regression equation:The regression tells about the relationship of two variables, one dependent and…
Q: The table shows the number of goals allowed and the total points earned (2 points for a win, and 1…
A:
Q: Interpret the values of the regression coefficients (intercept and slope)in this context. Note…
A: The regression analysis is conducted using EXCEL. The software procedure is given below: Enter the…
Q: For a linear regression b1 is the estimated y-intercept, and b0 is the estimated slope of the…
A: The general form of linear regression equation is, y=b0+b1x
Q: A regression study was done for 20 cities with latitude and average May temperature as the…
A: Given information: The data represents the results of regression analysis.
Q: Consider the regression equation y, = B, +B,x; +u;, i=1,..,N . %3D Exy, - Nãỹ Ex² - Nx? B = j-Bx.…
A: Using the given data on 10 observations. Taking 2nd column as X and 3rd column as Y.
Q: Consider the regression equation Y=a+bX. Assume that there is a relationship exists between the…
A: The linear regression equation is given as y=a+bx, where 'y' and 'x' are variables and 'a' and 'b'…
Q: Q1. If the regression equation is given by 4x –y + 5 = 0, then the slope of regression line of y on…
A: Given Data: Regression equation: 4x-y+5=0 Re-arranging the equation: 4x-y+5=0y=4x+5
Q: Different hotels in a certain area are randomly selected, and their ratings and prices were…
A: Given that, Different hotels in a certain area are randomly selected, and their ratings and prices…
Q: The estimated regression equation for a model involving two independent variables and 10…
A: The dependent variable is y. The independent variables are x1 and x2. This is multiple regression…
Q: The equation used to predict annual cauliflower yield (in pounds per acre) is y = 24,231 +4.417x, -…
A: The multiple linear regression equation is : y^=24231+4.471 x1-4.677 x2 (a) y^=24231 + (4.471×36100)…
Q: What is the null hypothesis to test the significance of the slope in a regression equation? Multiple…
A:
Q: Create scatterplots using the data in the spreadsheet linked above and display the equation for the…
A: Here we can see that the Regression equation between x and y is Y^ = 1.234*x + 1.234 where y is the…
Q: For a regression line in statistics, the symbol for the slope is and the symbol for the y' intercept…
A: Solution In the regression line the slope is coefficient of x and constant term is intercept.
Q: The table shows the number of goals allowed and the total points earned (2 points for a win, and 1…
A: The independent variable is Goals Allowed. The dependent variable is Points. This is simple linear…
Q: (a) Determine Sr. Syy. and Szy (b) Determine Bo, B. (c) Determine the estimated regression line…
A:
Q: A. Do these data provide sufficient evidence that there is a positive linear relationship between…
A: The regression concept was introduced by Sir Francis Galton and correlation is introduced by Karl…
Q: sports statistician was interested in the relationship between game attendance (in thousands) and…
A: Given equation is: ŷ = 4.9x + 15.2 Here, ŷ = Predicted number of wins (in thousands) x = Number…
Q: The table shows the number of goals allowed and the total points earned (2 points for a win, and 1…
A: Given,
Q: The table shows the number of goals allowed and the total points earned (2 points for a win, and 1…
A:
Q: Accountants at the Tucson firm, Larry Youdelman,CPAs, believed that several traveling executives…
A: Given data is y=90+48.50x1+0.40x2 Here, x1 = number of days x2 = distance traveled Correlation…


Learn your way
Includes step-by-step video

Step by step
Solved in 3 steps with 1 images

- The grades of a class of 9 students on a midterm report (x) and on the final examination (y) are as follows: Give the following: a. linear regression line and equation b. computation of the coefficient of determination ?^2 c. Computation of the coefficient of correlation ? d. Estimate the final examination grade of a student who received a grade of 85 on the midterm report.The head width (in) and weight (lb) is measured for a random sample of 20 bears.The data shows that the mean head width is 6.9 inches, mean weight is 214.3 lb, and thecorrelation r = 0.879 and its p-value is less than 0.0001. The suggested linear regressionequation is WEIGHT = -212 + 61.9 WIDTH.(a) How is the best predicted weight value of a given head width found with this data found?(b) For the preceding part, why?(c) Find the best predicted weight given a bear with a head with of 6.5 inches.The amount of kerosene used by a typical household in a week (Q, in litres) is found to have a strong correlation with the price of kerosene (P, in $). For 6 observations, the following data was collected:Q P11.4 4.0014 3.5016 3.0018 2.5020. 2.0022 1.50(a) Create a regression relationship for this data.(b) Perform a hypothesis test to determine whether the slope coefficient obtained in part (a) above issignificant. (c) Use the regression equation in part (a) above to predict the quantity of kerosene used by a household when the price is $3.75 per litre. (d) Calculate the price elasticity of demand for kerosene at a price of $3.75 (e) Using a further calculation, discuss how well the regression equation in part (a) above fits the data.(f) Discuss whether the relationship between the price and quantity could be due to the income effect, the substitution effect, or both
- The prelim grades (x) and midterm grades (y) of a sample of 10 MMW students is modeled by the regression line y = 12.0623 + 0.7771x. Estimate the prelim grade if the midterm grade is 83.Given the table below, Let y, x1, x2, and x3 be the time of concentration (t, in hr), watershed length (L in ft), watershed slope (S in %), and runoff curve number (CN): Evaluate the linear multiple regression model with two or three predictor variables. Compute the multiple correlation coefficient, the standard error of estimate, and the standard deviation of the variable y. Discuss the reliability of the modelA sample of 40 individuals collects their shoe size and the height (cm) for CSI data. The scatter plot and results from a simple linear regression are recorded: HEIGHT = 126.76238 + 4.8782178 SHOE SIZE Sample size: 40R (correlation coefficient) = 0.77918855P-value < 0.0001 (a) Does the scatterplot and results show a linear correlation between shoe size and height? (b) How can you tell? (c) Will it be appropriate to use the linear regression equation given in the output? (d) Krusty the Clown wears size 8.5 shoes. According to the linear regression equation, how tall is Krusty the Clown? (e) Sideshow Bob wears size 14 shoes. According to the linear regression equation, how tall is Sideshow Bob?
- The amount of gas used by a typical household in a week (Q, in litres) is found to have a strongcorrelation with the price of gas (P, in $). For 6 observations, the following data was collected:Q P11.4 4.0014 3.5016 3.0018 2.5020 2.00(a) Create a regression relationship for this data(b) Perform a hypothesis test to determine whether the slope coefficient obtained in part (a) above is statistically significant(c) Use the regression equation in part (a) above to predict the quantity of gas used by a household when the price is $3.75 per litre(d) Calculate the price elasticity of demand for gas at a price of $3.75 (e) Using a further calculation, discuss how well the regression equation in part (a) above fits the dataA car dealership would like to develop a regression model that would predict the number of cars sold per month by a dealership employee based on theemployee's number of years of sales experience. The accompanying regression output was developed based on a random sample of employees. ANOVA df SS Regression 1 79.909407 Residual 23 261.210593 Total 24 341.12 Coefficients Standard Error Intercept 7.271539 1.229763 Slope 0.539854 0.203521 The coefficient of determination is 0.234 Test statistic= 0.704 P-value= 0.014 Construct a 95% confidence interval around the sample slope and interpret its meaning. The confidence interval is (__________,_________). (Type an integer or decimal rounded to three decimal places as needed.)A ski resort asked a random sample of guests to rate their satisfaction on various attributes of their visit on a scale of 1–5 with 1 = very unsatisfied and 5 = very satisfied. The estimated regression model was Y = overall satisfaction score, X1 = lift line wait, X2 = amount of ski trail grooming, X3 = safety patrol visibility, and X4 = friendliness of guest services. Predictor Coefficient Intercept 2.7115 LiftWait 0.1474 AmountGroomed 0.2517 SkiPatrolVisibility 0.0656 FriendlinessHosts −0.1172 (a) Write the fitted regression equation. (Round your answers to 4 decimal places. Negative values should be indicated by a minus sign.) yˆy^ = ?? + ?? * LiftWait + ?? * AmountGroomed + ?? * SkiPatrolVisibility + ?? * FriendlinessHosts (b) Interpret each coefficient. Overall satisfaction increases Correctwith an increase in satisfaction for each individual predictor except for friendliness of hosts.(c) Would the intercept seem to have meaning in this…
- A car dealership would like to develop a regression model that would predict the number of cars sold per month by a dealership employee based on the employee's number of years of sales experience. The accompanying regression output was developed based on a random sample of employees. ANOVA df SS Regression 1 79.909407 Residual 23 261.210593 Total 24 341.12 Coefficients Standard Error Intercept 7.271539 1.229763 Slope 0.539854 Predict the sales next month for an employee with 2.5 years of experience. The predicted sales is _________ cars. (Type an integer or decimal rounded to one decimal place as needed.)A sociologist was hired by a large city hospital to investigate the relationship between the number of unauthorized days that employees are absent per year and the distance (miles) between home and work for the employee. A sample of 10 employees was chosen, and the following data were collected. A. Is the estimated regression equation appropriate and adequateThe accompanying data resulted from an experiment in which weld diameter and shear strength (in pounds) were determined for five different spot welds on steel. Below are the data collected and the regression equation. Diameter Strength 200.1 813.7 210.1 785.3 220.1 960.4 230.1 1118.0 240.0 1076.2 Strength = -941.6992 + 8.5988*Diameter The predicted y-hat value for a diameter of 201 is 864. if we observed a weld that had a diameter of 235 that had a strength 1000, what would be its residual?