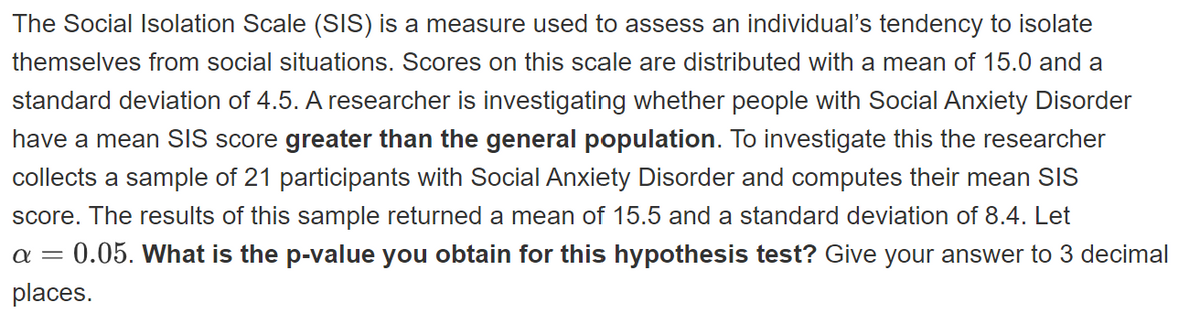
The Social Isolation Scale (SIS) is a measure used to assess an individual's tendency to isolate themselves from social situations. Scores on this scale are distributed with a mean of 15.0 and a standard deviation of 4.5. A researcher is investigating whether people with Social Anxiety Disorder have a mean SIS score greater than the general population. To investigate this the researcher collects a sample of 21 participants with Social Anxiety Disorder and computes their mean SIS score. The results of this sample returned a mean of 15.5 and a standard deviation of 8.4. Let 0.05. What is the p-value you obtain for this hypothesis test? Give your answer to 3 decimal a = places.
The Social Isolation Scale (SIS) is a measure used to assess an individual's tendency to isolate themselves from social situations. Scores on this scale are distributed with a mean of 15.0 and a standard deviation of 4.5. A researcher is investigating whether people with Social Anxiety Disorder have a mean SIS score greater than the general population. To investigate this the researcher collects a sample of 21 participants with Social Anxiety Disorder and computes their mean SIS score. The results of this sample returned a mean of 15.5 and a standard deviation of 8.4. Let 0.05. What is the p-value you obtain for this hypothesis test? Give your answer to 3 decimal a = places.

MATLAB: An Introduction with Applications
6th Edition
ISBN:9781119256830
Author:Amos Gilat
Publisher:Amos Gilat
Chapter1: Starting With Matlab
Section: Chapter Questions
Problem 1P

Related questions
Question
Transcribed Image Text:The Social Isolation Scale (SIS) is a measure used to assess an individual's tendency to isolate
themselves from social situations. Scores on this scale are distributed with a mean of 15.0 and a
standard deviation of 4.5. A researcher is investigating whether people with Social Anxiety Disorder
have a mean SIS score greater than the general population. To investigate this the researcher
collects a sample of 21 participants with Social Anxiety Disorder and computes their mean SIS
score. The results of this sample returned a mean of 15.5 and a standard deviation of 8.4. Let
- 0.05. What is the p-value you obtain for this hypothesis test? Give your answer to 3 decimal
places.
Expert Solution
This question has been solved!
Explore an expertly crafted, step-by-step solution for a thorough understanding of key concepts.

This is a popular solution!

Trending now
This is a popular solution!

Step by step
Solved in 2 steps with 2 images

Recommended textbooks for you
MATLAB: An Introduction with Applications
Statistics
ISBN:
9781119256830
Author:
Amos Gilat
Publisher:
John Wiley & Sons Inc

Probability and Statistics for Engineering and th…
Statistics
ISBN:
9781305251809
Author:
Jay L. Devore
Publisher:
Cengage Learning

Statistics for The Behavioral Sciences (MindTap C…
Statistics
ISBN:
9781305504912
Author:
Frederick J Gravetter, Larry B. Wallnau
Publisher:
Cengage Learning
MATLAB: An Introduction with Applications
Statistics
ISBN:
9781119256830
Author:
Amos Gilat
Publisher:
John Wiley & Sons Inc
Probability and Statistics for Engineering and th…
Statistics
ISBN:
9781305251809
Author:
Jay L. Devore
Publisher:
Cengage Learning
Statistics for The Behavioral Sciences (MindTap C…
Statistics
ISBN:
9781305504912
Author:
Frederick J Gravetter, Larry B. Wallnau
Publisher:
Cengage Learning

Elementary Statistics: Picturing the World (7th E…
Statistics
ISBN:
9780134683416
Author:
Ron Larson, Betsy Farber
Publisher:
PEARSON

The Basic Practice of Statistics
Statistics
ISBN:
9781319042578
Author:
David S. Moore, William I. Notz, Michael A. Fligner
Publisher:
W. H. Freeman

Introduction to the Practice of Statistics
Statistics
ISBN:
9781319013387
Author:
David S. Moore, George P. McCabe, Bruce A. Craig
Publisher:
W. H. Freeman