The state test scores for 12 randomly selected high school seniors are shown on the right Complete parts (a) through (e) below. 1424 1220 980 694 729 836 723 621 Assume the population is normally distributed. 744 540 1442 942 .... (a) Find the sample mean. x= (Round to one decimal place as needed.)
The state test scores for 12 randomly selected high school seniors are shown on the right Complete parts (a) through (e) below. 1424 1220 980 694 729 836 723 621 Assume the population is normally distributed. 744 540 1442 942 .... (a) Find the sample mean. x= (Round to one decimal place as needed.)

Glencoe Algebra 1, Student Edition, 9780079039897, 0079039898, 2018
18th Edition
ISBN:9780079039897
Author:Carter
Publisher:Carter
Chapter10: Statistics
Section10.4: Distributions Of Data
Problem 19PFA

Related questions
Question
Please find stanard deviation and 99% confidence interval for the population
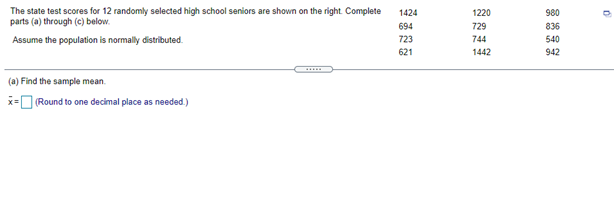
Transcribed Image Text:The state test scores for 12 randomly selected high school seniors are shown on the right Complete
parts (a) through (e) below.
1424
1220
980
694
729
836
Assume the population is normally distributed.
723
744
540
621
1442
942
(a) Find the sample mean.
x= (Round to one decimal place as needed.)
Expert Solution
This question has been solved!
Explore an expertly crafted, step-by-step solution for a thorough understanding of key concepts.

This is a popular solution!

Trending now
This is a popular solution!

Step by step
Solved in 2 steps with 2 images

Recommended textbooks for you
Glencoe Algebra 1, Student Edition, 9780079039897…
Algebra
ISBN:
9780079039897
Author:
Carter
Publisher:
McGraw Hill
Glencoe Algebra 1, Student Edition, 9780079039897…
Algebra
ISBN:
9780079039897
Author:
Carter
Publisher:
McGraw Hill