The student newspaper called Campus Press polled a simple random sample of 280 undergraduate students in order to study student attitude toward a proposed change in dormitory regulations. Students responded as supporting, opposing, or standing neutral with regards to the issue. The numbers are displayed in the table below. Student attitude Support Neutral Oppose Total 158 73 49 280 Suppose the Campus press suspects that half of the students support the change in regulations and 20% of them oppose. What is the value of the chi-square statistic under the appropriate null hypothesis? 0.875 4.63 2 2.31
The student newspaper called Campus Press polled a simple random sample of 280 undergraduate students in order to study student attitude toward a proposed change in dormitory regulations. Students responded as supporting, opposing, or standing neutral with regards to the issue. The numbers are displayed in the table below. Student attitude Support Neutral Oppose Total 158 73 49 280 Suppose the Campus press suspects that half of the students support the change in regulations and 20% of them oppose. What is the value of the chi-square statistic under the appropriate null hypothesis? 0.875 4.63 2 2.31

Holt Mcdougal Larson Pre-algebra: Student Edition 2012
1st Edition
ISBN:9780547587776
Author:HOLT MCDOUGAL
Publisher:HOLT MCDOUGAL
Chapter11: Data Analysis And Probability
Section11.4: Collecting Data
Problem 6E

Related questions
Question
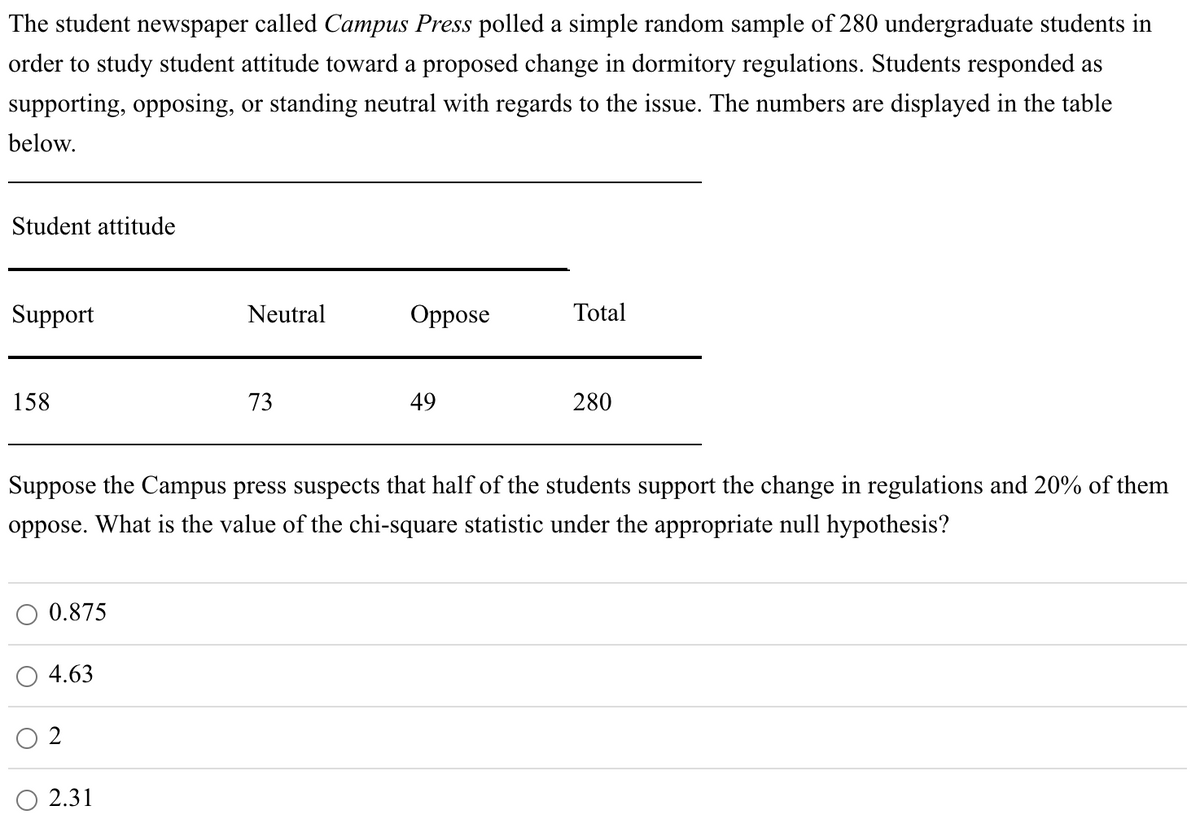
Transcribed Image Text:The student newspaper called Campus Press polled a simple random sample of 280 undergraduate students in
order to study student attitude toward a proposed change in dormitory regulations. Students responded as
supporting, opposing, or standing neutral with regards to the issue. The numbers are displayed in the table
below.
Student attitude
Support
Neutral
Oppose
Total
158
73
49
280
Suppose the Campus press suspects that half of the students support the change in regulations and 20% of them
oppose. What is the value of the chi-square statistic under the appropriate null hypothesis?
0.875
4.63
2.31
Expert Solution
This question has been solved!
Explore an expertly crafted, step-by-step solution for a thorough understanding of key concepts.

This is a popular solution!

Trending now
This is a popular solution!

Step by step
Solved in 2 steps

Recommended textbooks for you
Holt Mcdougal Larson Pre-algebra: Student Edition…
Algebra
ISBN:
9780547587776
Author:
HOLT MCDOUGAL
Publisher:
HOLT MCDOUGAL

College Algebra (MindTap Course List)
Algebra
ISBN:
9781305652231
Author:
R. David Gustafson, Jeff Hughes
Publisher:
Cengage Learning
Holt Mcdougal Larson Pre-algebra: Student Edition…
Algebra
ISBN:
9780547587776
Author:
HOLT MCDOUGAL
Publisher:
HOLT MCDOUGAL
College Algebra (MindTap Course List)
Algebra
ISBN:
9781305652231
Author:
R. David Gustafson, Jeff Hughes
Publisher:
Cengage Learning