The superintendent of a school district wanted to predict the percentage of students passing a sixth-grade proficiency test. She obtained the data on percentage of students passing the proficiency test (% Passing), mean teacher salary in thousands of dollars (Salaries), and instructional spending per pupil in thousands of dollars (Spending) of 47 schools in the state Following is the mubiple regression output with Y = % Passing as the dependert variable, X, = Salaries and X = Spending. E Click the icon to view the results. Determine whother the following statement is true or false: You can conclude definitively that mean teacher salary individualy has no impact on the mean percentage of studerts passing the proficiency test, taking into account the effect of that instructional spending per pupil, at a 10% kevel of significance based solely on but not actually computing the 90% confidence interval esamate for B - x Regression Statistics O True Regression Stotistics Multiple R O False 0.4276 R Square 0.1828 Adjusted R Square 0.1457 Standard Error r 5.7351 Observations 47 ANOVA dr Significance F SS MS 2 323.8284 4.9227 Regression Residual 161.9142 0.0118 44 1447.2094 32.8911 Total 46 1771.0378 Coefficients Standord Error Stot P-value Lower 95% Upper 95% Intercept -72.9916 45.9106 -1.5899 0.1190 -165.5184 19.5352 Salary 2.7939 0.8974 3.1133 0.0032 0.9853 4.6025 Spending 0.3742 0.9782 0.3825 0.7039 -1.5972 2.3455
The superintendent of a school district wanted to predict the percentage of students passing a sixth-grade proficiency test. She obtained the data on percentage of students passing the proficiency test (% Passing), mean teacher salary in thousands of dollars (Salaries), and instructional spending per pupil in thousands of dollars (Spending) of 47 schools in the state Following is the mubiple regression output with Y = % Passing as the dependert variable, X, = Salaries and X = Spending. E Click the icon to view the results. Determine whother the following statement is true or false: You can conclude definitively that mean teacher salary individualy has no impact on the mean percentage of studerts passing the proficiency test, taking into account the effect of that instructional spending per pupil, at a 10% kevel of significance based solely on but not actually computing the 90% confidence interval esamate for B - x Regression Statistics O True Regression Stotistics Multiple R O False 0.4276 R Square 0.1828 Adjusted R Square 0.1457 Standard Error r 5.7351 Observations 47 ANOVA dr Significance F SS MS 2 323.8284 4.9227 Regression Residual 161.9142 0.0118 44 1447.2094 32.8911 Total 46 1771.0378 Coefficients Standord Error Stot P-value Lower 95% Upper 95% Intercept -72.9916 45.9106 -1.5899 0.1190 -165.5184 19.5352 Salary 2.7939 0.8974 3.1133 0.0032 0.9853 4.6025 Spending 0.3742 0.9782 0.3825 0.7039 -1.5972 2.3455

Algebra & Trigonometry with Analytic Geometry
13th Edition
ISBN:9781133382119
Author:Swokowski
Publisher:Swokowski
Chapter7: Analytic Trigonometry
Section7.6: The Inverse Trigonometric Functions
Problem 94E

Related questions
Question
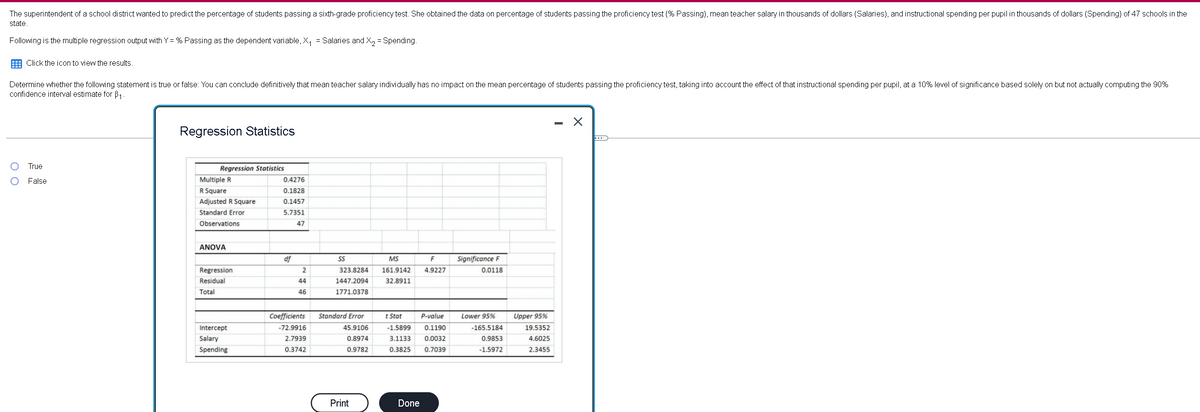
Transcribed Image Text:The superintendent of a school district wanted to predict the percentage of students passing a sixth-grade proficiency test. She obtained the data on percentage of students passing the proficiency test (% Passing), mean teacher salary in thousands of dollars (Salaries), and instructional spending per pupil in thousands of dollars (Spending) of 47 schools in the
state.
Following is the multiple regression output with Y= % Passing as the dependent variable, X, = Salaries and X, = Spending.
E Click the icon to view the results.
Determine whether the following statement is true or false: You can conclude definitively that mean teacher salary individually has no impact on the mean percentage of students passing the proficiency test, taking into account the effect of that instructional spending per pupil, at a 10% level of significance based solely on but not actually computing the 90%
confidence interval estimate for B,.
- X
Regression Statistics
True
Regression Statistics
False
Multiple R
0.4276
R Square
0.1828
Adjusted R Square
0.1457
Standard Error
5.7351
Observations
47
ANOVA
df
SS
MS
Significance F
Regression
2
323.8284
161.9142
4.9227
0.0118
Residual
44
1447.2094
32.8911
Total
46
1771.0378
Coefficients
Standard Error
t Stat
P-value
Lower 95%
Upper 95%
Intercept
-72.9916
45.9106
-1.5899
0.1190
-165.5184
19.5352
Salary
2.7939
0.8974
3.1133
0.0032
0.9853
4,6025
Spending
0.3742
0.9782
0.3825
0.7039
-1.5972
2.3455
Print
Done
Expert Solution
This question has been solved!
Explore an expertly crafted, step-by-step solution for a thorough understanding of key concepts.

This is a popular solution!

Trending now
This is a popular solution!

Step by step
Solved in 2 steps

Recommended textbooks for you
Algebra & Trigonometry with Analytic Geometry
Algebra
ISBN:
9781133382119
Author:
Swokowski
Publisher:
Cengage

Functions and Change: A Modeling Approach to Coll…
Algebra
ISBN:
9781337111348
Author:
Bruce Crauder, Benny Evans, Alan Noell
Publisher:
Cengage Learning

Algebra and Trigonometry (MindTap Course List)
Algebra
ISBN:
9781305071742
Author:
James Stewart, Lothar Redlin, Saleem Watson
Publisher:
Cengage Learning
Algebra & Trigonometry with Analytic Geometry
Algebra
ISBN:
9781133382119
Author:
Swokowski
Publisher:
Cengage
Functions and Change: A Modeling Approach to Coll…
Algebra
ISBN:
9781337111348
Author:
Bruce Crauder, Benny Evans, Alan Noell
Publisher:
Cengage Learning
Algebra and Trigonometry (MindTap Course List)
Algebra
ISBN:
9781305071742
Author:
James Stewart, Lothar Redlin, Saleem Watson
Publisher:
Cengage Learning


Glencoe Algebra 1, Student Edition, 9780079039897…
Algebra
ISBN:
9780079039897
Author:
Carter
Publisher:
McGraw Hill