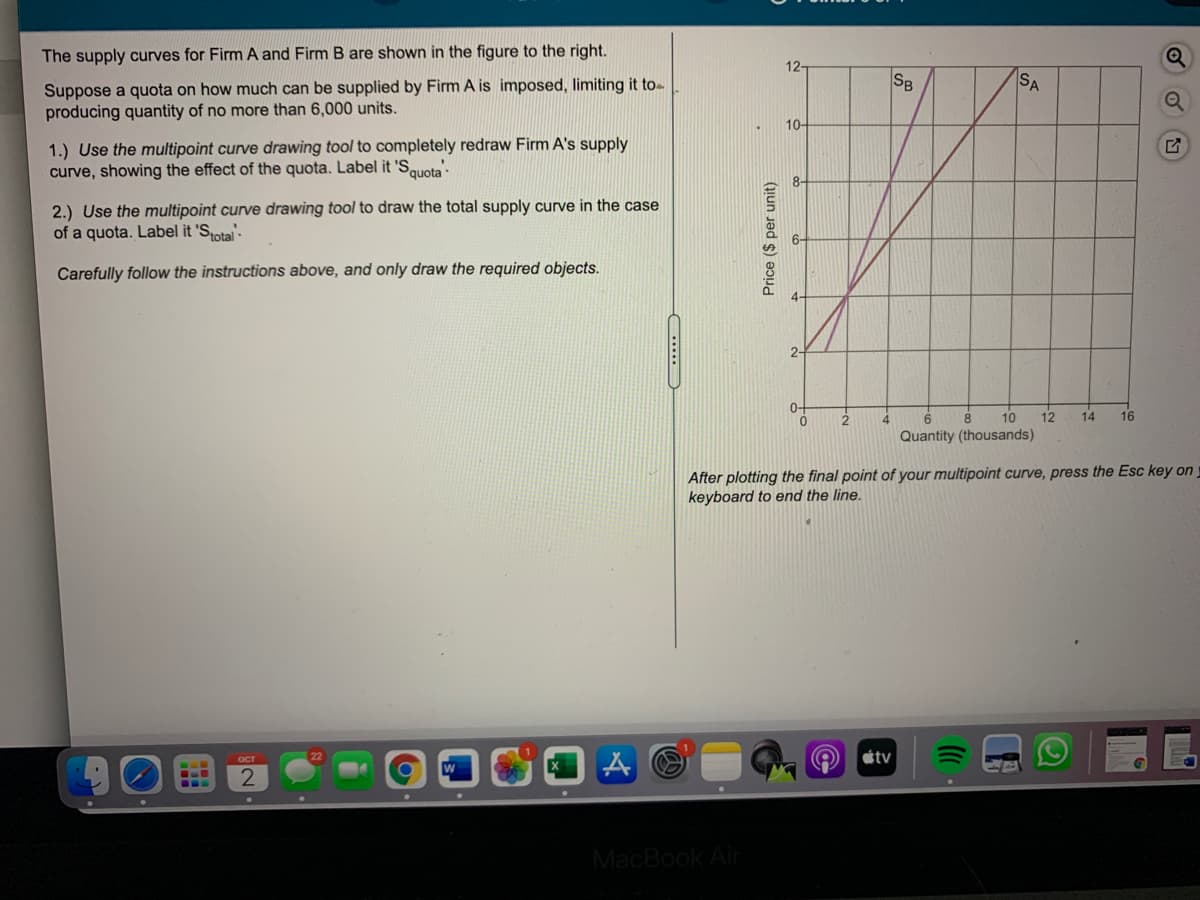
The supply curves for Firm A and Firm B are shown in the figure to the right. Suppose a quota on how much can be supplied by Firm A is imposed, limiting it to- producing quantity of no more than 6,000 units. 1.) Use the multipoint curve drawing tool to completely redraw Firm A's supply curve, showing the effect of the quota. Label it 'SQuota 2.) Use the multipoint curve drawing tool to draw the total supply curve in the case of a quota. Label it 'Stotal Carefully follow the instructions above, and only draw the required objects.
The supply curves for Firm A and Firm B are shown in the figure to the right. Suppose a quota on how much can be supplied by Firm A is imposed, limiting it to- producing quantity of no more than 6,000 units. 1.) Use the multipoint curve drawing tool to completely redraw Firm A's supply curve, showing the effect of the quota. Label it 'SQuota 2.) Use the multipoint curve drawing tool to draw the total supply curve in the case of a quota. Label it 'Stotal Carefully follow the instructions above, and only draw the required objects.

MATLAB: An Introduction with Applications
6th Edition
ISBN:9781119256830
Author:Amos Gilat
Publisher:Amos Gilat
Chapter1: Starting With Matlab
Section: Chapter Questions
Problem 1P

Related questions
Question
100%
Transcribed Image Text:The supply curves for Firm A and Firm B are shown in the figure to the right.
12-
SB
SA
Suppose a quota on how much can be supplied by Firm A is imposed, limiting it to-
producing quantity of no more than 6,000 units.
10-
1.) Use the multipoint curve drawing tool to completely redraw Firm A's supply
curve, showing the effect of the quota. Label it 'Souota
8-
2.) Use the multipoint curve drawing tool to draw the total supply curve in the case
of a quota. Label it 'Sotal-
Carefully follow the instructions above, and only draw the required objects.
10
12
14
16
Quantity (thousands)
After plotting the final point of your multipoint curve, press the Esc key on
keyboard to end the line.
étv
OCT
W
...
MacBook Air
...
Price ($ per unit)
Expert Solution
This question has been solved!
Explore an expertly crafted, step-by-step solution for a thorough understanding of key concepts.

This is a popular solution!

Trending now
This is a popular solution!

Step by step
Solved in 4 steps with 4 images

Recommended textbooks for you
MATLAB: An Introduction with Applications
Statistics
ISBN:
9781119256830
Author:
Amos Gilat
Publisher:
John Wiley & Sons Inc

Probability and Statistics for Engineering and th…
Statistics
ISBN:
9781305251809
Author:
Jay L. Devore
Publisher:
Cengage Learning

Statistics for The Behavioral Sciences (MindTap C…
Statistics
ISBN:
9781305504912
Author:
Frederick J Gravetter, Larry B. Wallnau
Publisher:
Cengage Learning
MATLAB: An Introduction with Applications
Statistics
ISBN:
9781119256830
Author:
Amos Gilat
Publisher:
John Wiley & Sons Inc
Probability and Statistics for Engineering and th…
Statistics
ISBN:
9781305251809
Author:
Jay L. Devore
Publisher:
Cengage Learning
Statistics for The Behavioral Sciences (MindTap C…
Statistics
ISBN:
9781305504912
Author:
Frederick J Gravetter, Larry B. Wallnau
Publisher:
Cengage Learning

Elementary Statistics: Picturing the World (7th E…
Statistics
ISBN:
9780134683416
Author:
Ron Larson, Betsy Farber
Publisher:
PEARSON

The Basic Practice of Statistics
Statistics
ISBN:
9781319042578
Author:
David S. Moore, William I. Notz, Michael A. Fligner
Publisher:
W. H. Freeman

Introduction to the Practice of Statistics
Statistics
ISBN:
9781319013387
Author:
David S. Moore, George P. McCabe, Bruce A. Craig
Publisher:
W. H. Freeman