The survey done by Pulse Asia (February 22-March 3, 2021) revealed that 52% of Filipinos prefer Pfizer COVID-19 vaccine. A team made a survey on which brand of COVID-19 vaccine the residents of Barangay Smit prefer. The team found out that of the 878 respondents, 434 prefer the Pfizer vaccine. Test at a=5% if this is similar to the result of the given Pulse Asia survey. Null Hypothesis: Alternative Hypothesis: Level of significance: Test statistic: Computation: Critical Value(s): Conclusion:
The survey done by Pulse Asia (February 22-March 3, 2021) revealed that 52% of Filipinos prefer Pfizer COVID-19 vaccine. A team made a survey on which brand of COVID-19 vaccine the residents of Barangay Smit prefer. The team found out that of the 878 respondents, 434 prefer the Pfizer vaccine. Test at a=5% if this is similar to the result of the given Pulse Asia survey. Null Hypothesis: Alternative Hypothesis: Level of significance: Test statistic: Computation: Critical Value(s): Conclusion:

Holt Mcdougal Larson Pre-algebra: Student Edition 2012
1st Edition
ISBN:9780547587776
Author:HOLT MCDOUGAL
Publisher:HOLT MCDOUGAL
Chapter11: Data Analysis And Probability
Section: Chapter Questions
Problem 8CR

Related questions
Question
(3.b)
Please help me answer this one.
Show all the necessary solutions. Type only the answers here, please do not handwritten it.
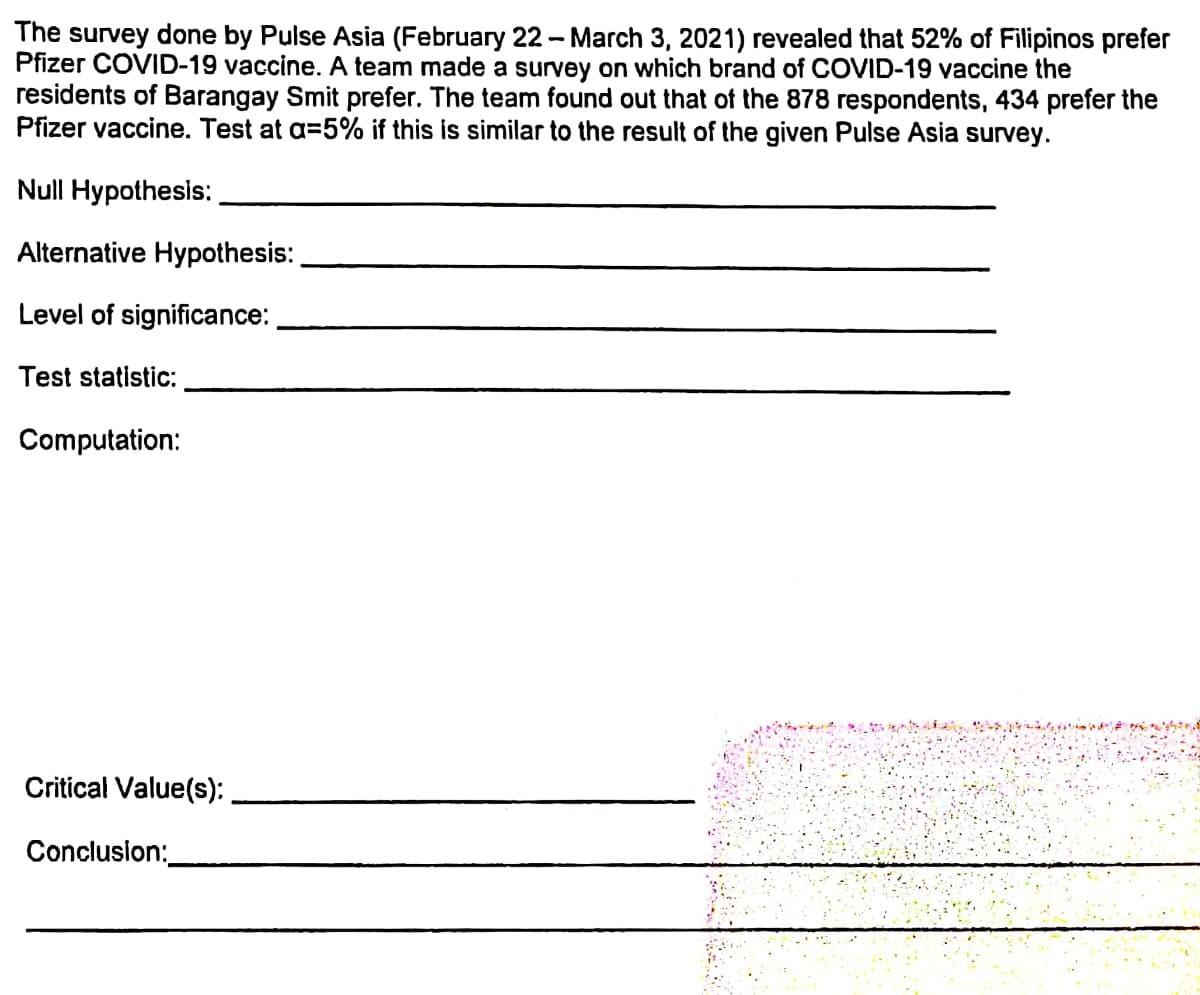
Transcribed Image Text:The survey done by Pulse Asia (February 22-March 3, 2021) revealed that 52% of Filipinos prefer
Pfizer COVID-19 vaccine. A team made a survey on which brand of COVID-19 vaccine the
residents of Barangay Smit prefer. The team found out that of the 878 respondents, 434 prefer the
Pfizer vaccine. Test at a=5% if this is similar to the result of the given Pulse Asia survey.
Null Hypothesis:
Alternative Hypothesis:
Level of significance:
Test statistic:
Computation:
Critical Value(s):
Conclusion:
Expert Solution
This question has been solved!
Explore an expertly crafted, step-by-step solution for a thorough understanding of key concepts.

This is a popular solution!

Trending now
This is a popular solution!

Step by step
Solved in 2 steps

Recommended textbooks for you
Holt Mcdougal Larson Pre-algebra: Student Edition…
Algebra
ISBN:
9780547587776
Author:
HOLT MCDOUGAL
Publisher:
HOLT MCDOUGAL
Holt Mcdougal Larson Pre-algebra: Student Edition…
Algebra
ISBN:
9780547587776
Author:
HOLT MCDOUGAL
Publisher:
HOLT MCDOUGAL