The systolic blood pressure of individuals is thought to be related to both age and weight. Let the systolic blood pressure, age, and weight be represented by the variables x1, x2, and x3, respectively. Suppose that Minitab was used to generate the following descriptive statistics, correlations, and regression analysis for a random sample of 15 individuals.
The systolic blood pressure of individuals is thought to be related to both age and weight. Let the systolic blood pressure, age, and weight be represented by the variables x1, x2, and x3, respectively. Suppose that Minitab was used to generate the following descriptive statistics, correlations, and regression analysis for a random sample of 15 individuals.

Glencoe Algebra 1, Student Edition, 9780079039897, 0079039898, 2018
18th Edition
ISBN:9780079039897
Author:Carter
Publisher:Carter
Chapter4: Equations Of Linear Functions
Section4.6: Regression And Median-fit Lines
Problem 4GP

Related questions
Question
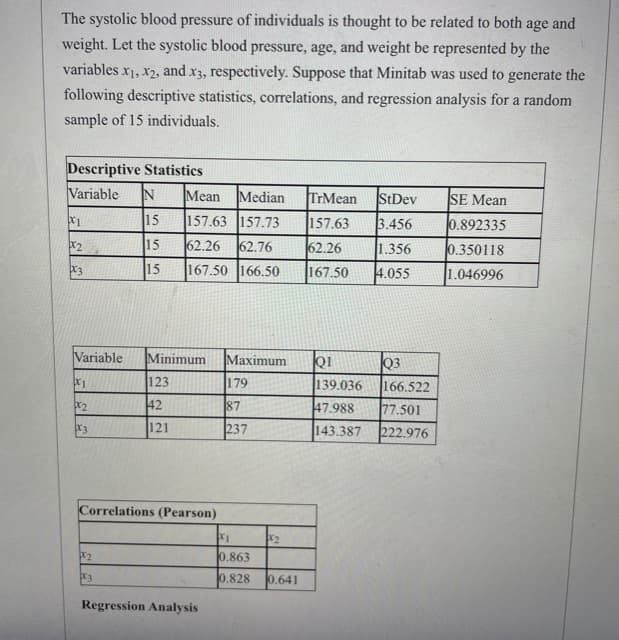
Transcribed Image Text:The systolic blood pressure of individuals is thought to be related to both age and
weight. Let the systolic blood pressure, age, and weight be represented by the
variables x1, x2, and x3, respectively. Suppose that Minitab was used to generate the
following descriptive statistics, correlations, and regression analysis for a random
sample of 15 individuals.
Descriptive Statistics
Variable
Mean
15
157.63 157.73
15
Median
TrMean
StDev
SE Mean
157.63
3.456
0.892335
62.26
62.76
167.50 166.50
62.26
1.356
0.350118
15
167.50
4.055
1.046996
Variable
Minimum
Маximum
Q3
166.522
77.501
123
179
139.036
x2
42
87
47.988
X3
121
237
143.387
222.976
Correlations (Pearson)
x2
0.863
0.828
0.641
Regression Analysis
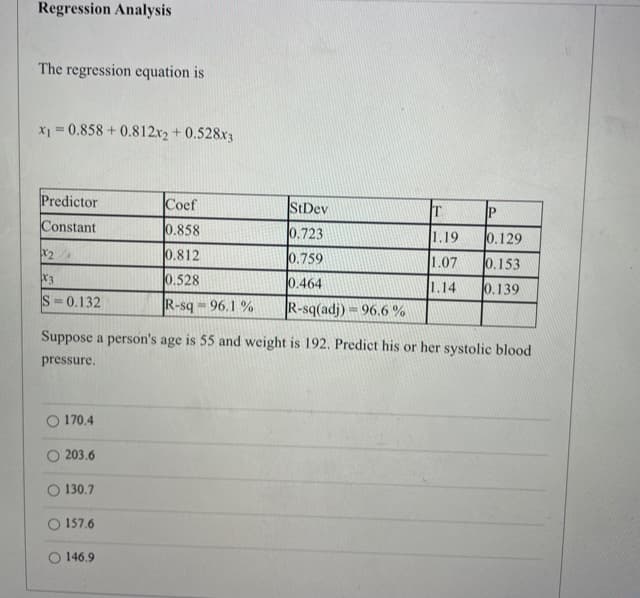
Transcribed Image Text:Regression Analysis
The regression equation is
X1 =0.858 + 0.812x2 +0.528x3
%3D
Predictor
Coef
StDev
Constant
0.858
0.723
1.19
0.129
X2
0.812
0.759
1.07
0.153
X3
0.528
0.464
1.14
0.139
S-0.132
R-sq = 96.1 %
R-sq(adj)=96.6 %
Suppose a person's age is 55 and weight is 192. Predict his or her systolic blood
pressure.
O 170.4
203.6
O 130.7
157.6
O 146.9
Expert Solution
This question has been solved!
Explore an expertly crafted, step-by-step solution for a thorough understanding of key concepts.

This is a popular solution!

Trending now
This is a popular solution!

Step by step
Solved in 2 steps with 1 images

Recommended textbooks for you
Glencoe Algebra 1, Student Edition, 9780079039897…
Algebra
ISBN:
9780079039897
Author:
Carter
Publisher:
McGraw Hill
Glencoe Algebra 1, Student Edition, 9780079039897…
Algebra
ISBN:
9780079039897
Author:
Carter
Publisher:
McGraw Hill