The table below gives the country's GDP, population size, and price level over a three-year period. 2018 2019 2020 Nominal GDP 14999 16866 23851 Population 213 291 337 Price Level 100 105 116 Given the information above, calculate the following: (d) The Real GDP in 2020 () Nominal GDP per capita growth rate between 2019 and 2020 % (e) Nominal GDP growth rate between 2018 and 2019 (g) Real GDP growth rate between 2018 and 2019 %
The table below gives the country's GDP, population size, and price level over a three-year period. 2018 2019 2020 Nominal GDP 14999 16866 23851 Population 213 291 337 Price Level 100 105 116 Given the information above, calculate the following: (d) The Real GDP in 2020 () Nominal GDP per capita growth rate between 2019 and 2020 % (e) Nominal GDP growth rate between 2018 and 2019 (g) Real GDP growth rate between 2018 and 2019 %

Essentials of Economics (MindTap Course List)
8th Edition
ISBN:9781337091992
Author:N. Gregory Mankiw
Publisher:N. Gregory Mankiw
Chapter15: Measuring A Nation's Income
Section: Chapter Questions
Problem 7PA

Related questions
Question
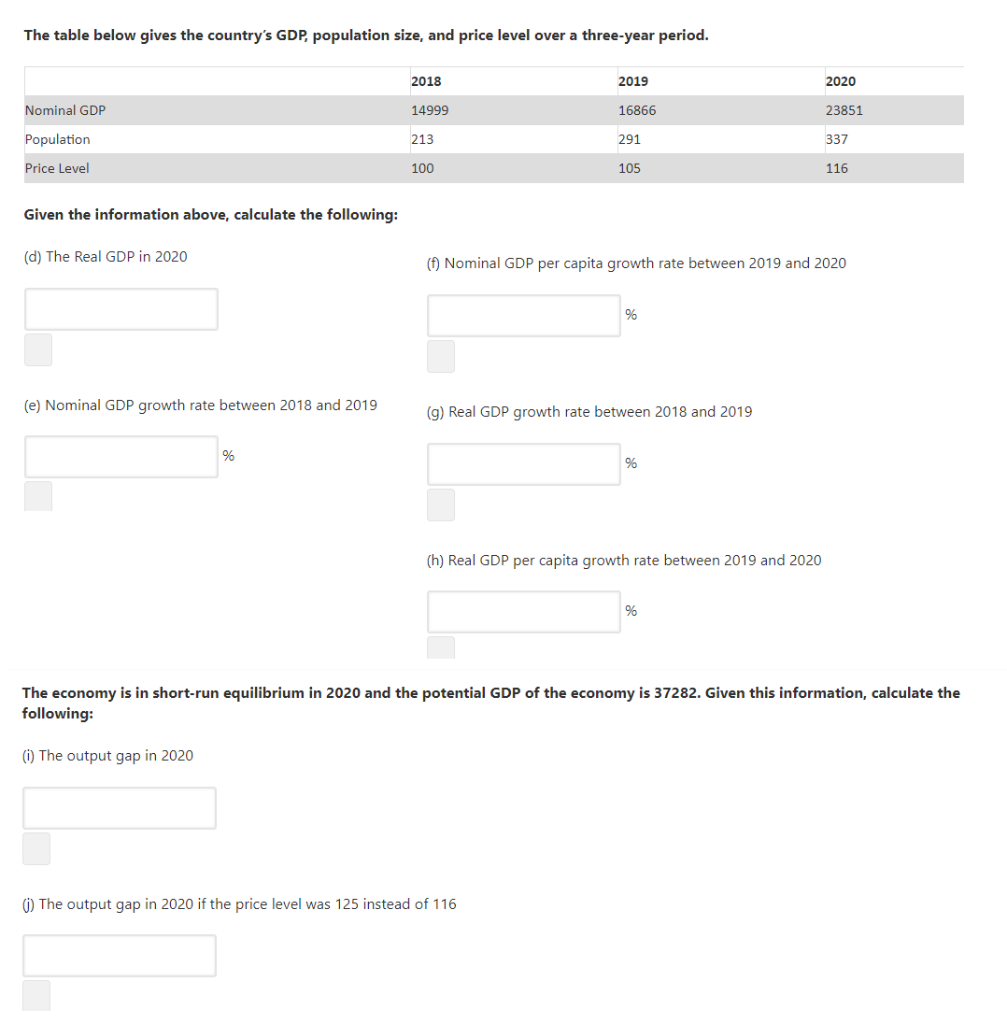
Transcribed Image Text:The table below gives the country's GDP, population size, and price level over a three-year period.
2018
2019
2020
Nominal GDP
14999
16866
23851
Population
213
291
337
Price Level
100
105
116
Given the information above, calculate the following:
(d) The Real GDP in 2020
(f) Nominal GDP per capita growth rate between 2019 and 2020
%
(e) Nominal GDP growth rate between 2018 and 2019
(g) Real GDP growth rate between 2018 and 2019
%
(h) Real GDP per capita growth rate between 2019 and 2020
The economy is in short-run equilibrium in 2020 and the potential GDP of the economy is 37282. Given this information, calculate the
following:
(i) The output gap in 2020
(j) The output gap in 2020 if the price level was 125 instead of 116
Expert Solution
This question has been solved!
Explore an expertly crafted, step-by-step solution for a thorough understanding of key concepts.

This is a popular solution!

Trending now
This is a popular solution!

Step by step
Solved in 2 steps

Recommended textbooks for you
Essentials of Economics (MindTap Course List)
Economics
ISBN:
9781337091992
Author:
N. Gregory Mankiw
Publisher:
Cengage Learning

Brief Principles of Macroeconomics (MindTap Cours…
Economics
ISBN:
9781337091985
Author:
N. Gregory Mankiw
Publisher:
Cengage Learning

Principles of Economics 2e
Economics
ISBN:
9781947172364
Author:
Steven A. Greenlaw; David Shapiro
Publisher:
OpenStax
Essentials of Economics (MindTap Course List)
Economics
ISBN:
9781337091992
Author:
N. Gregory Mankiw
Publisher:
Cengage Learning
Brief Principles of Macroeconomics (MindTap Cours…
Economics
ISBN:
9781337091985
Author:
N. Gregory Mankiw
Publisher:
Cengage Learning
Principles of Economics 2e
Economics
ISBN:
9781947172364
Author:
Steven A. Greenlaw; David Shapiro
Publisher:
OpenStax