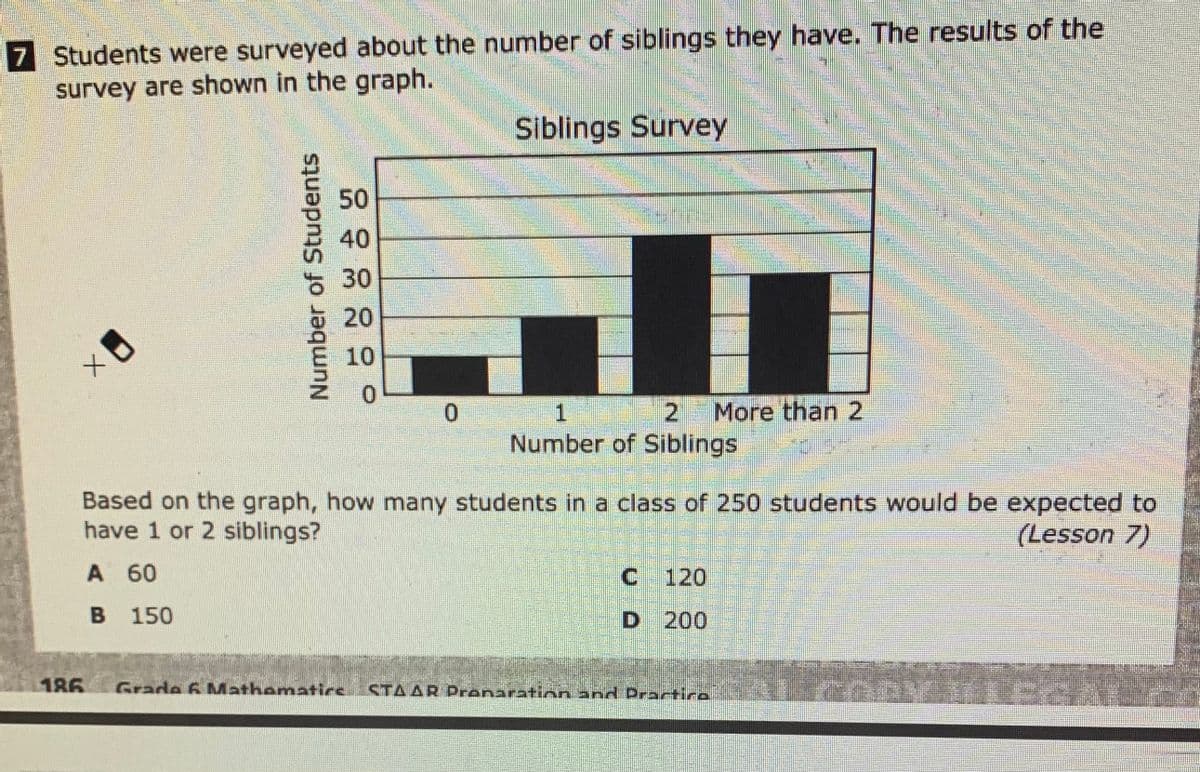
7 Students were surveyed about the number of siblings they have. The results of the survey are shown in the graph. Siblings Survey 50 40 30 20 10 1 2 More than 2 Number of Siblings Based on the graph, how many students in a class of 250 students would be expected to have 1 or 2 siblings? (Lesson 7) Number of Students


Contingency Table
A contingency table can be defined as the visual representation of the relationship between two or more categorical variables that can be evaluated and registered. It is a categorical version of the scatterplot, which is used to investigate the linear relationship between two variables. A contingency table is indeed a type of frequency distribution table that displays two variables at the same time.
Binomial Distribution
Binomial is an algebraic expression of the sum or the difference of two terms. Before knowing about binomial distribution, we must know about the binomial theorem.
Based on the graph how many students in a class of 250 students would be expected to have 1 or 2 siblings?


Trending now
This is a popular solution!

Step by step
Solved in 2 steps with 2 images


