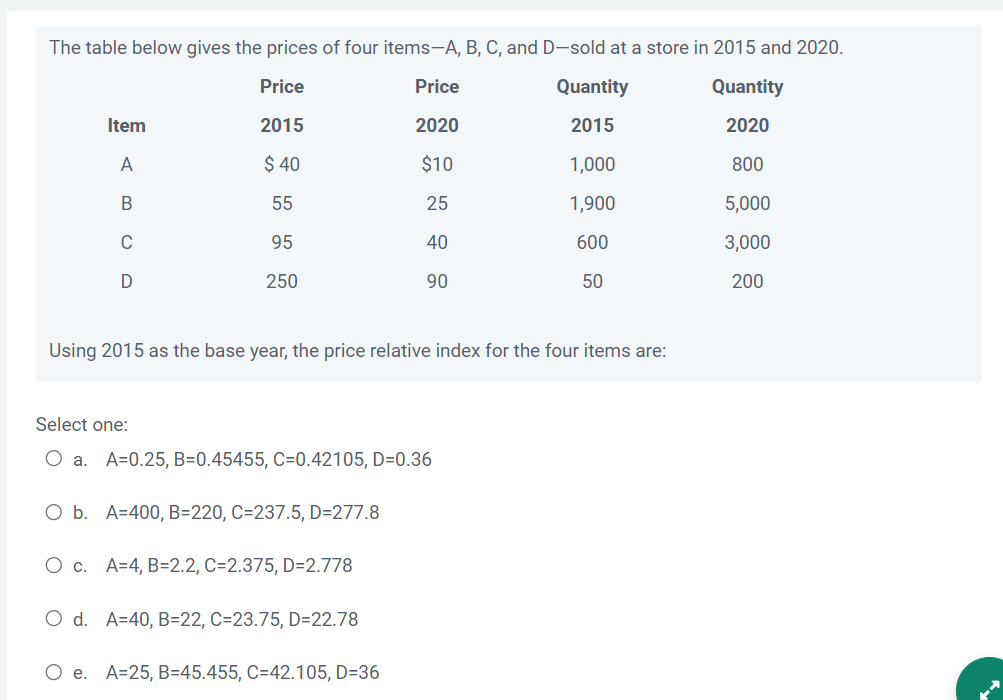
The table below gives the prices of four items-A, B, C, and D-sold at a store in 2015 and 2020. Price Price Quantity Quantity Item 2015 2020 2015 2020 A $ 40 $10 1,000 800 B 55 25 1,900 5,000 C 95 40 600 3,000 D 250 90 50 200 Using 2015 as the base year, the price relative index for the four items are:
The table below gives the prices of four items-A, B, C, and D-sold at a store in 2015 and 2020. Price Price Quantity Quantity Item 2015 2020 2015 2020 A $ 40 $10 1,000 800 B 55 25 1,900 5,000 C 95 40 600 3,000 D 250 90 50 200 Using 2015 as the base year, the price relative index for the four items are:

Glencoe Algebra 1, Student Edition, 9780079039897, 0079039898, 2018
18th Edition
ISBN:9780079039897
Author:Carter
Publisher:Carter
Chapter10: Statistics
Section10.6: Summarizing Categorical Data
Problem 23PPS

Related questions
Question
Transcribed Image Text:The table below gives the prices of four items-A, B, C, and D-sold at a store in 2015 and 2020.
Price
Price
Quantity
Quantity
Item
2015
2020
2015
2020
A
$ 40
$10
1,000
800
B
55
25
1,900
5,000
C
95
40
600
3,000
D
250
90
50
200
Using 2015 as the base year, the price relative index for the four items are:
Select one:
O a. A=0.25, B=0.45455, C=0.42105, D=0.36
O b. A=400, B=220, C=237.5, D=277.8
O c. A=4, B=2.2, C=2.375, D=2.778
O d. A=40, B=22, C=23.75, D=22.78
O e. A=25, B=45.455, C-42.105, D=36
Expert Solution
This question has been solved!
Explore an expertly crafted, step-by-step solution for a thorough understanding of key concepts.

Step by step
Solved in 2 steps with 1 images

Recommended textbooks for you
Glencoe Algebra 1, Student Edition, 9780079039897…
Algebra
ISBN:
9780079039897
Author:
Carter
Publisher:
McGraw Hill
Glencoe Algebra 1, Student Edition, 9780079039897…
Algebra
ISBN:
9780079039897
Author:
Carter
Publisher:
McGraw Hill