The table below lists the numbers of audience impressions (in hundreds of millions) listening to songs and the corresponding numbers of albums sold (in hundreds impressions? Use a significance level of a = 0.05. Audience Impressions 22 thousands). Does it appear that album sales are affected very strongly by the number audience 23 14 16 12 18 15 18 15 Albums Sold | 14 8 10
The table below lists the numbers of audience impressions (in hundreds of millions) listening to songs and the corresponding numbers of albums sold (in hundreds impressions? Use a significance level of a = 0.05. Audience Impressions 22 thousands). Does it appear that album sales are affected very strongly by the number audience 23 14 16 12 18 15 18 15 Albums Sold | 14 8 10

Glencoe Algebra 1, Student Edition, 9780079039897, 0079039898, 2018
18th Edition
ISBN:9780079039897
Author:Carter
Publisher:Carter
Chapter10: Statistics
Section10.1: Measures Of Center
Problem 9PPS

Related questions
Topic Video
Question
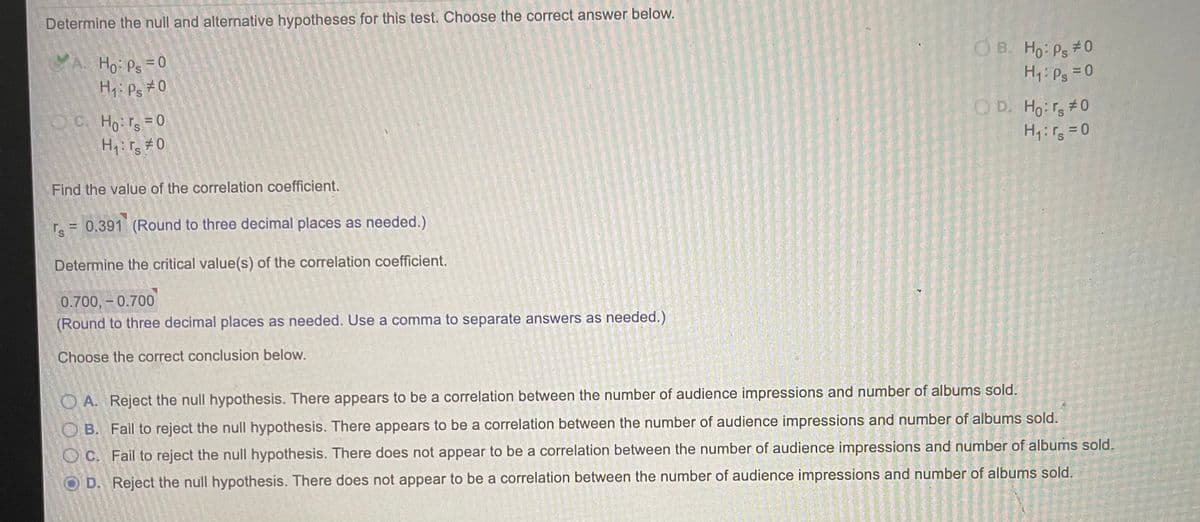
Transcribed Image Text:Determine the null and alternative hypotheses for this test. Choose the correct answer below.
YA. Ho: Ps 0
H: Ps #0
O B. Ho Ps #0
H1:Ps = 0
O D. Ho: r #0
OC. Ho: rs=0
Find the value of the correlation coefficient.
r. = 0.391 (Round to three decimal places as needed.)
Ts
Determine the critical value(s) of the correlation coefficient.
0.700,-0.700
(Round to three decimal places as needed. Use a comma to separate answers as needed.)
Choose the correct conclusion below.
O A. Reject the null hypothesis. There appears to be a correlation between the number of audience impressions and number of albums sold.
O B. Fail to reject the null hypothesis. There appears to be a correlation between the number of audience impressions and number of albums sold.
O C. Fail to reject the null hypothesis. There does not appear to be a correlation between the number of audience impressions and number of albums sold.
O D. Reject the null hypothesis. There does not appear to be a correlation between the number of audience impressions and number of albums sold.
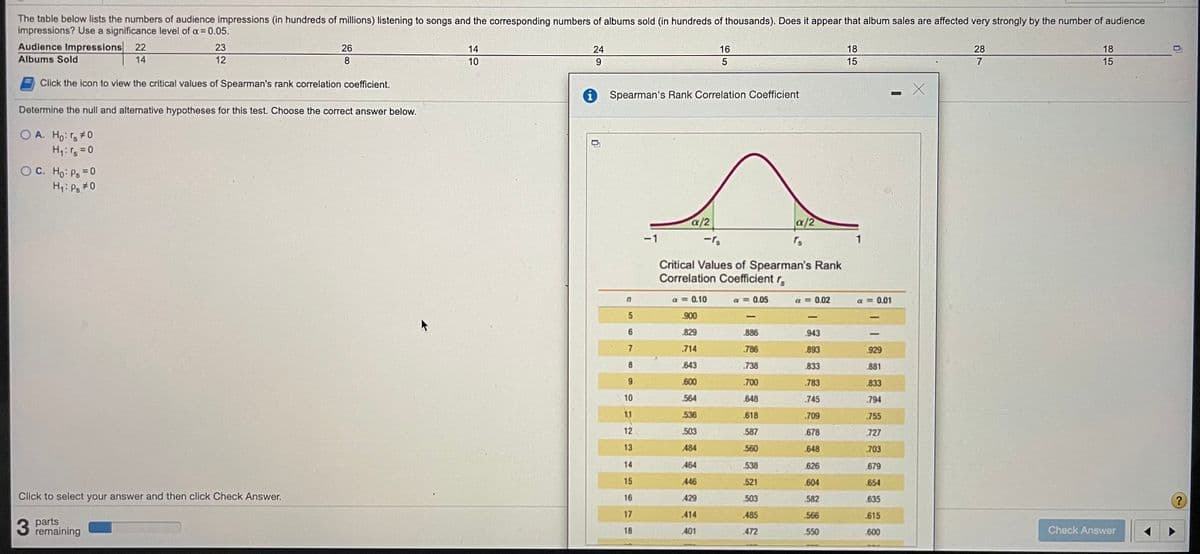
Transcribed Image Text:The table below lists the numbers of audience impressions (in hundreds of millions) listening to songs and the corresponding numbers of albums sold (in hundreds of thousands). Does it appear that album sales are affected very strongly by the number of audience
impressions? Use a significance level of a = 0.05.
Audience Impressions 22
23
26
14
24
16
18
28
18
Albums Sold
14
12
10
9.
15
15
Click the icon to view the critical values of Spearman's rank correlation coefficient.
Spearman's Rank Correlation Coefficient
Determine the null and alternative hypotheses for this test. Choose the correct answer below.
O A. Ho: rs #0
H,: r = 0
OC. Ho: Ps =0
H1: Ps #0
%3D
a/2
a/2
-1
1
Critical Values of Spearman's Rank
Correlation Coefficient r,
a = 0.10
a = 0.05
a = 0.02
a = 0.01
.900
6.
829
886
.943
7
.714
.786
.893
929
8.
643
.738
833
881
9.
600
.700
.783
833
10
564
648
.745
794
11
536
.618
.709
755
12
.503
587
.678
727
13
484
560
.648
703
14
464
538
.626
.679
15
.446
.521
.604
654
Click to select your answer and then click Check Answer.
16
429
503
.582
635
17
.414
.485
.566
.615
parts
remaining
18
401
472
.550
.600
Check Answer
Expert Solution
This question has been solved!
Explore an expertly crafted, step-by-step solution for a thorough understanding of key concepts.

This is a popular solution!

Trending now
This is a popular solution!

Step by step
Solved in 2 steps

Knowledge Booster


Learn more about
Need a deep-dive on the concept behind this application? Look no further. Learn more about this topic, statistics and related others by exploring similar questions and additional content below.Recommended textbooks for you
Glencoe Algebra 1, Student Edition, 9780079039897…
Algebra
ISBN:
9780079039897
Author:
Carter
Publisher:
McGraw Hill
Glencoe Algebra 1, Student Edition, 9780079039897…
Algebra
ISBN:
9780079039897
Author:
Carter
Publisher:
McGraw Hill